Debugging RP2040 Pico C/C++ SDK Projects using Raspberry Pi Debug Probe & VS Code
Learn how to use the official Pico Debug Probe to debug your Raspberry Pi Pico RP2040 C/C++ SDK projects using VS Code.
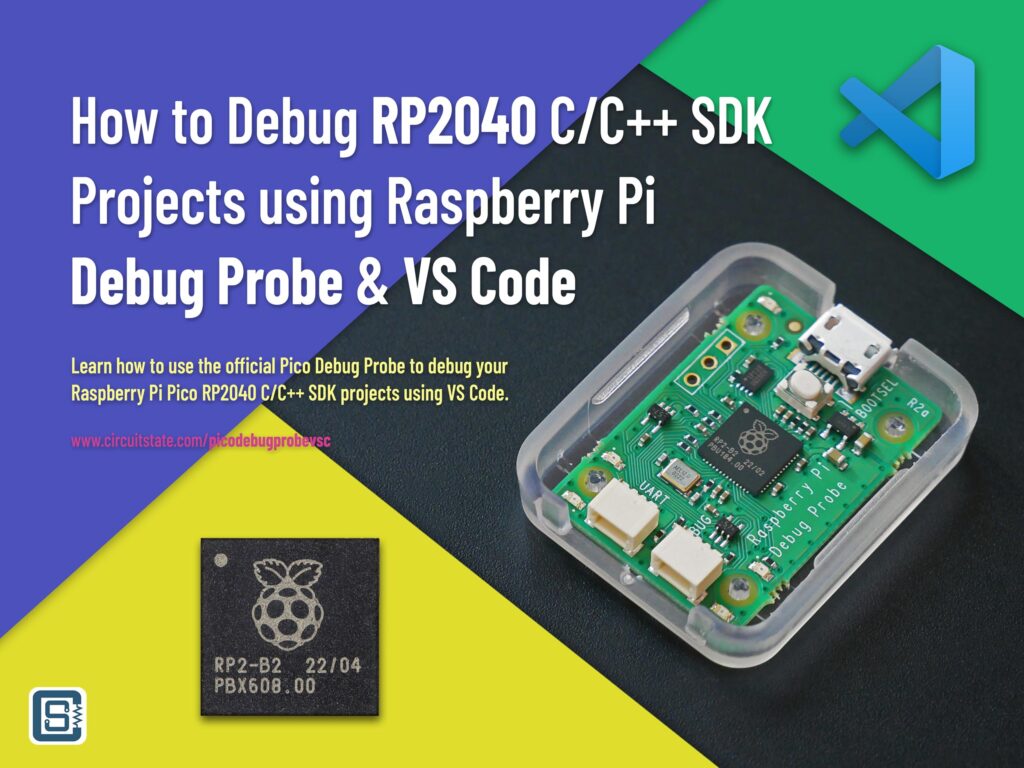
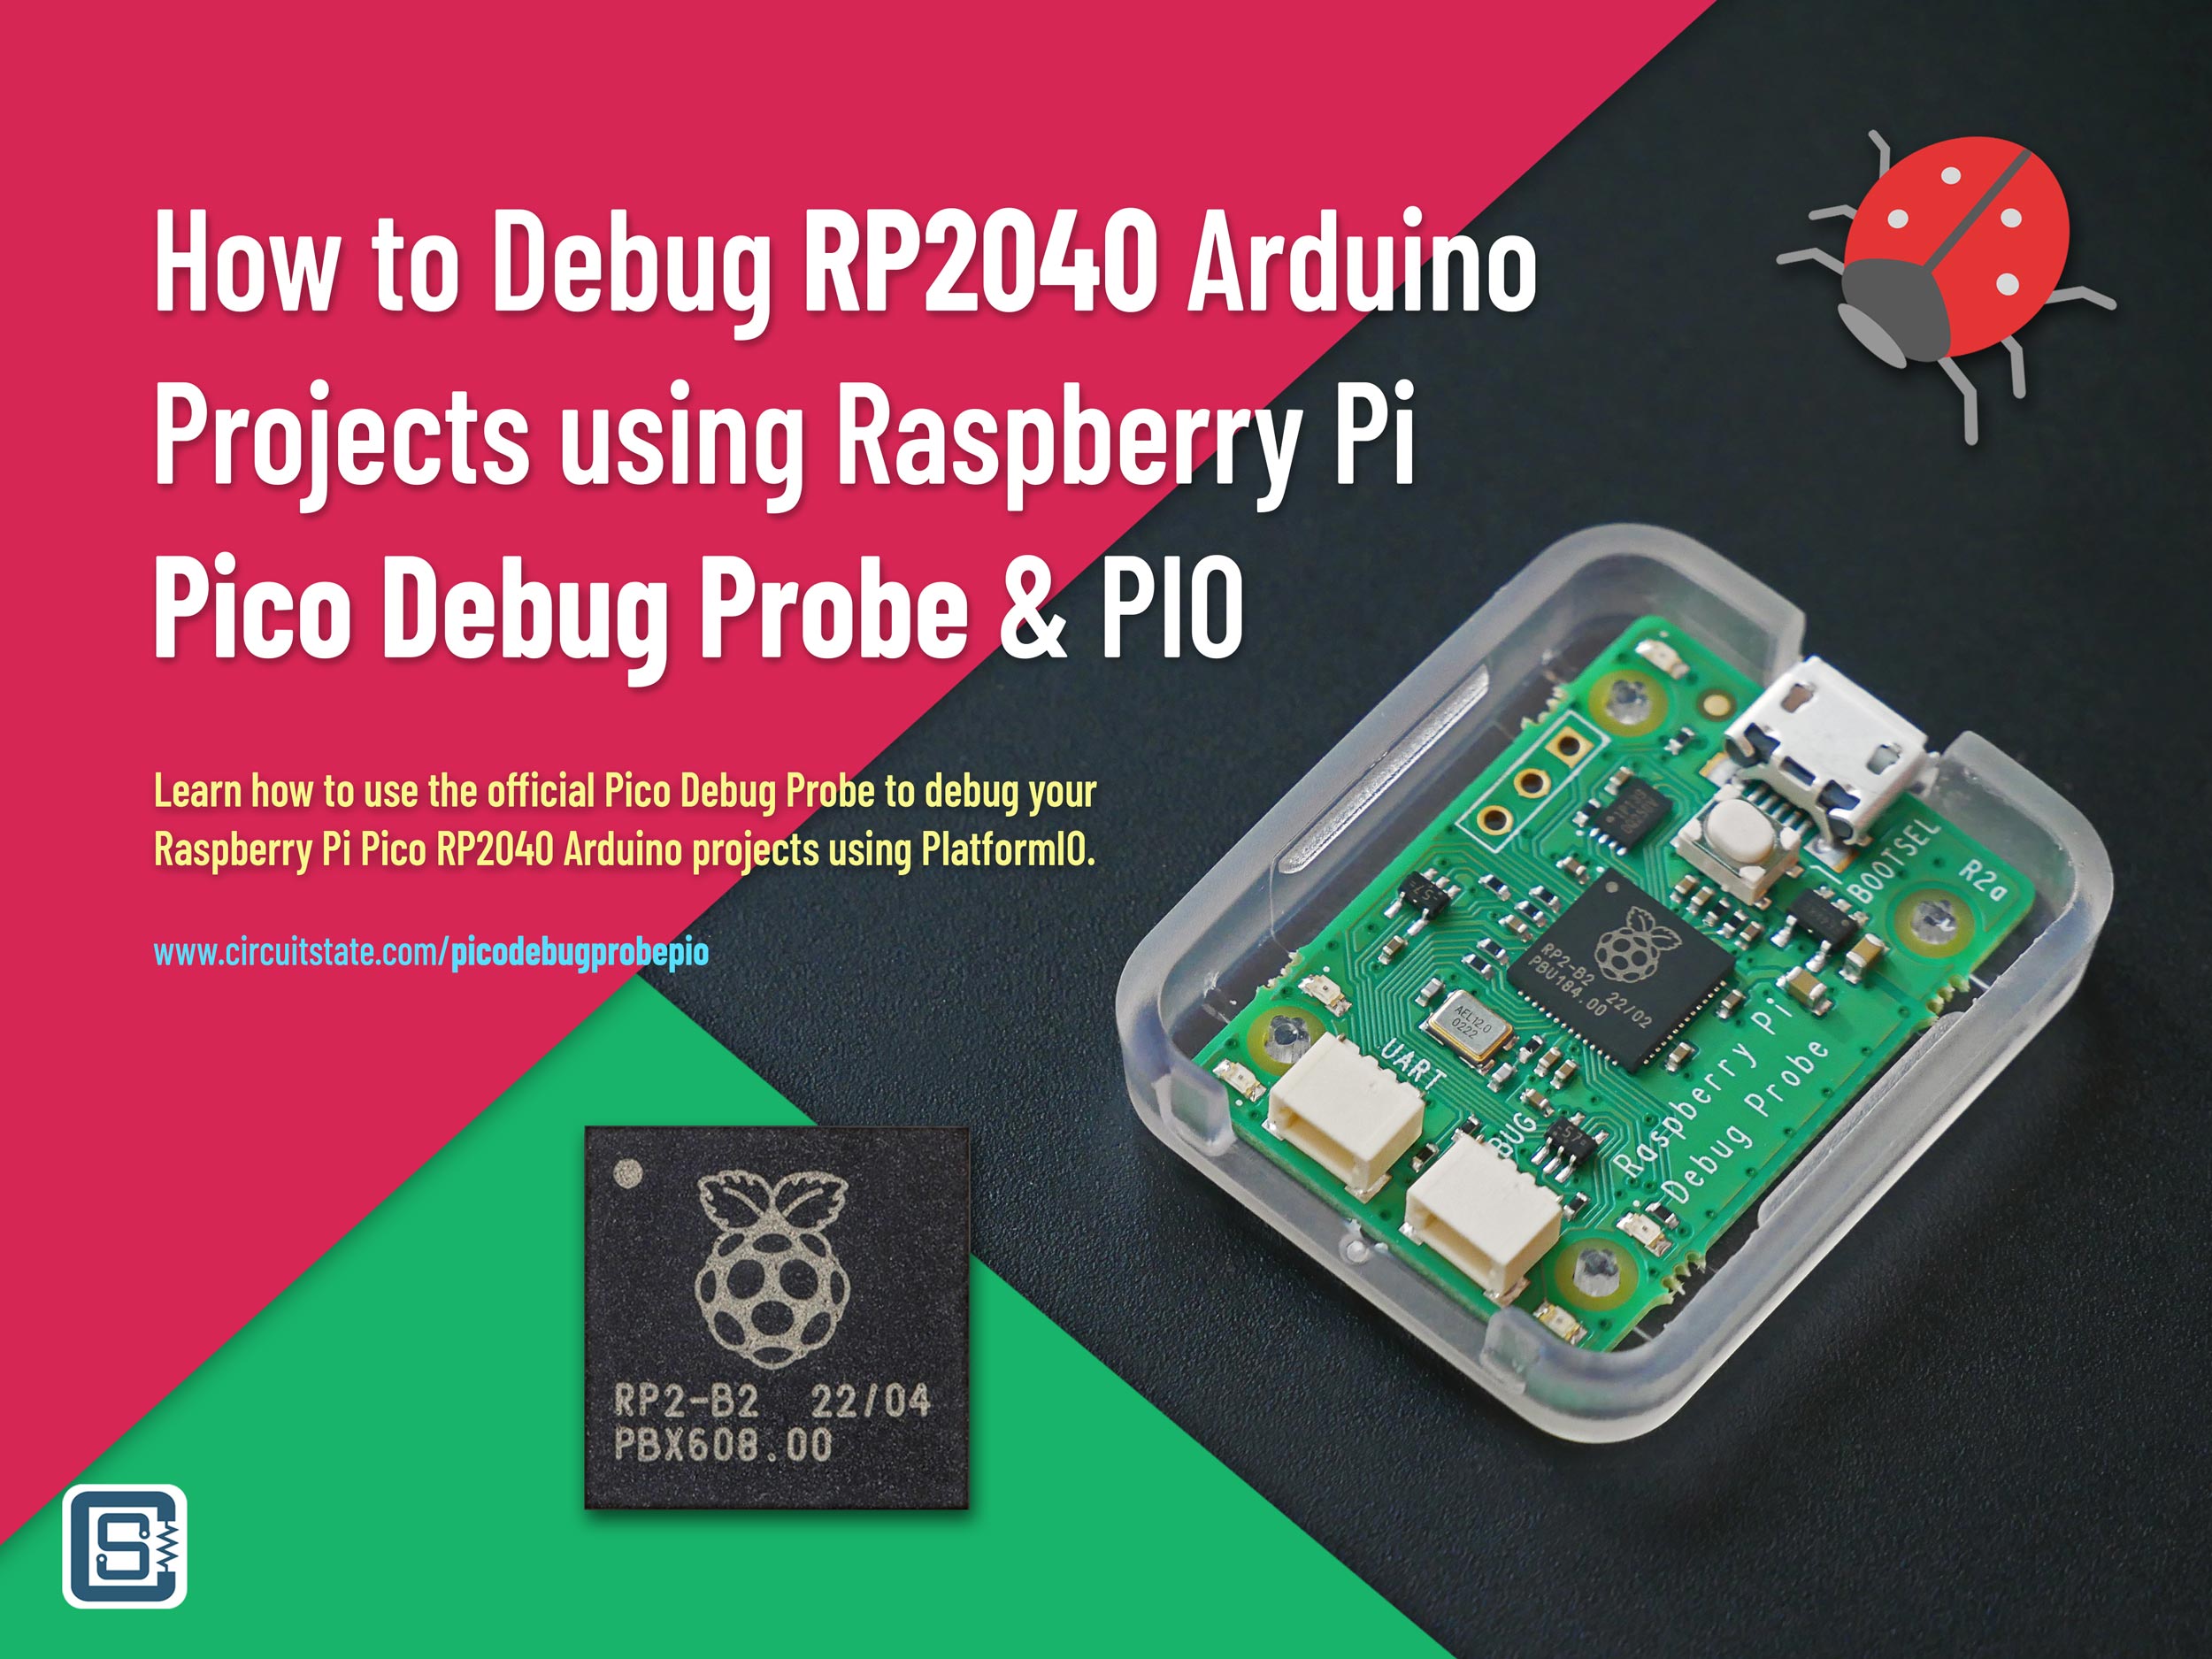
In our previous post, we showed you how you can use the official Raspberry Pi Debug Probe to debug your RP2040 Arduino projects using PlatformIO and VS Code. But what if you want to use the official Pico C/C++ SDK to develop software for the RP2040 microcontroller and want to use the Debug Probe for debugging? Well, that is what we are going to cover in this tutorial. This post has many similarities and repetitions to the previous post. It is done only for the completion of the tutorial. We have more RP2040 tutorials on CIRCUITSTATE and feel free to check them out.
How to Debug RP2040 Arduino Projects Using Raspberry Pi Debug Probe & PlatformIO
We can develop embedded firmware for you
CIRCUITSTATE can develop embedded firmware for any microcontroller/microprocessor including 8051, PIC, AVR, ARM, STM32, ESP32, and RISC-V using industry-leading SDKs, frameworks, and tools. Contact us today to share your requirements.
What is Debugging?
A bug is an issue in a design. A design could be an algorithm, software, mechanical, electronic, and so on. But the term is mostly used in relation to software and hardware. Debugging is the process of finding and fixing bugs in the design. There is an interesting history behind the origin of the term “bug” which you can read on Wikipedia. Bugs are issues in software/hardware that result in unintended behaviors. Bugs can be caused by human programmers, underlying hardware, or due to random effects (such as bit flips). Since most of the bugs are human-made, they can be fixed through debugging. Ideally, all bugs should be identified and fixed during the testing phase of development. However, conditions in the testing lab may be too ideal and far from the actual deployment environment. Due to that, many bugs only pop up during the actual deployment.
The methods and techniques used for debugging vary depending on what type of system you are trying to debug. You will need specialized tools and methods for each type. The most well-known debugging methods and tools are applicable to software and hardware debugging. In this post will stick with hardware debugging where we will fix bugs on microprocessor/microcontroller-based embedded systems.
Embedded Debugging
There are many methods and tools for debugging embedded hardware, which are mostly created by the manufacturers of the hardware. A few of the general and well-known methods are,
- Trace Code
- Done by adding extra print statements in the main code. This will print variable or other input-output information to a console.
- Simplest of all techniques.
- Can create overhead to the main code and add latency.
- In-Circuit Debugging
- Carried out with a dedicated tool called In-Circuit Debugger (ICD).
- ICD can access system resources and control its behavior including process pause/resume, stepping through instructions, and inspecting variables and registers.
- A debugger front-end is used to do debugging.
- Probing
- Measuring, logging, and visualizing electrical signals in digital or analog domain.
- Can be done with logic analyzers, protocol analyzers, or oscilloscopes.
- System Dumping
- Dumping system resources such as memory contents to be analyzed later.
- Simulation
- Uses a virtual model of the system to be tested.
- Computationally intensive, complex, and expensive.
- Don’t always replicate real-world conditions.
RP2040
RP2040 is a dual-core ARM Cortex-M0+ processor with 264KB on-chip SRAM and supports up to 16MB of off-chip flash memory for program storage. The CPUs run at 133 MHz and the chip supports a variety of peripherals. RP2040 is the first microcontroller from the Raspberry Pi Foundation. You can learn more about the RP2040 microcontroller and the official Raspberry Pi Pico boards from our tutorials.
Getting Started with Raspberry Pi Pico : RP2040 Microcontroller Board – Pinout, Schematic and Programming Tutorial
Specifications
- Dual ARM Cortex-M0+ @ 133MHz
- On-chip PLL allows variable core frequency
- 264kByte high-performance SRAM in six independent banks
- Support for up to 16MB of off-chip Flash memory via a dedicated QSPI bus with eXecute In Place (XIP)
- DMA controller
- Fully-connected AHB crossbar
- Interpolator and integer divider peripherals
- On-chip programmable LDO to generate the core voltage
- 2 on-chip PLLs to generate USB and core clocks
- 30 multi-function General Purpose IO (4 can be used for ADC)
- 1.8-3.3V IO Voltage (NOTE: Pico IO voltage is fixed at 3.3V)
- 12-bit 500ksps Analogue to Digital Converter (ADC)
- Peripherals
- 2 UARTs
- 2 SPI controllers
- 2 I2C controllers
- 16 PWM channels
- USB 1.1 controller and PHY, with host and device support
- 8 PIO state machines
- 2 × Programmable IO (PIO) blocks, 8 state machines total
- Flexible, user-programmable high-speed IO
- Can emulate interfaces such as SD Card and VGA
- QFN-56 7x7mm package
SWD
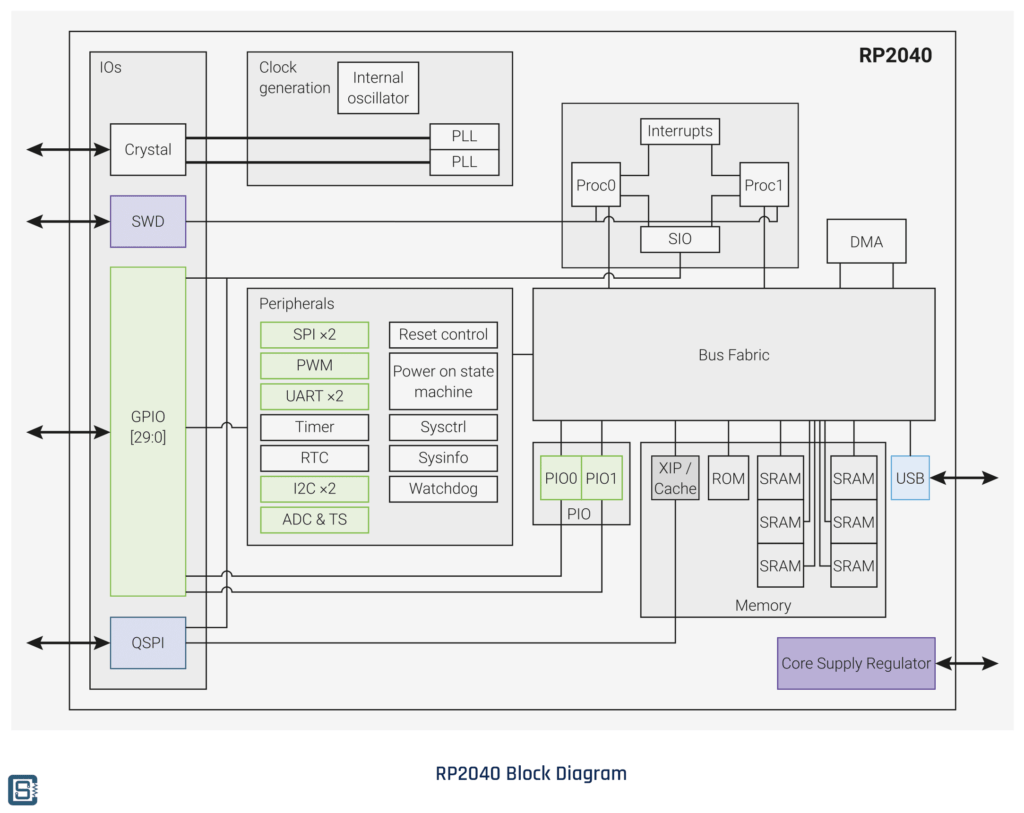
SWD (Serial Wire Debug) is a two-wire bidirectional debug interface exclusively found in ARM controllers. It uses the same JTAG IEEE 1149.1 protocol but only uses two wires (in addition to the GND) for the physical interface instead of 4 in JTAG. This simplifies connection to the target microcontroller from a debug probe. SWD allows you to access the CPU registers, peripheral registers, and memory for real-time inspection and stepping through instructions. The two signals associated with SWD are SWCLK (Clock) and SWDIO (Data In/out). RP2040 integrates an SWD peripheral inside the chip and you can spot it on the internal block diagram. The SWD signals are assigned to dedicated pins on RP2040.
| Name | Pins | Description |
|---|---|---|
| SWCLK | 24 | SWD Clock |
| SWDIO | 25 | SWD Data In and Out |
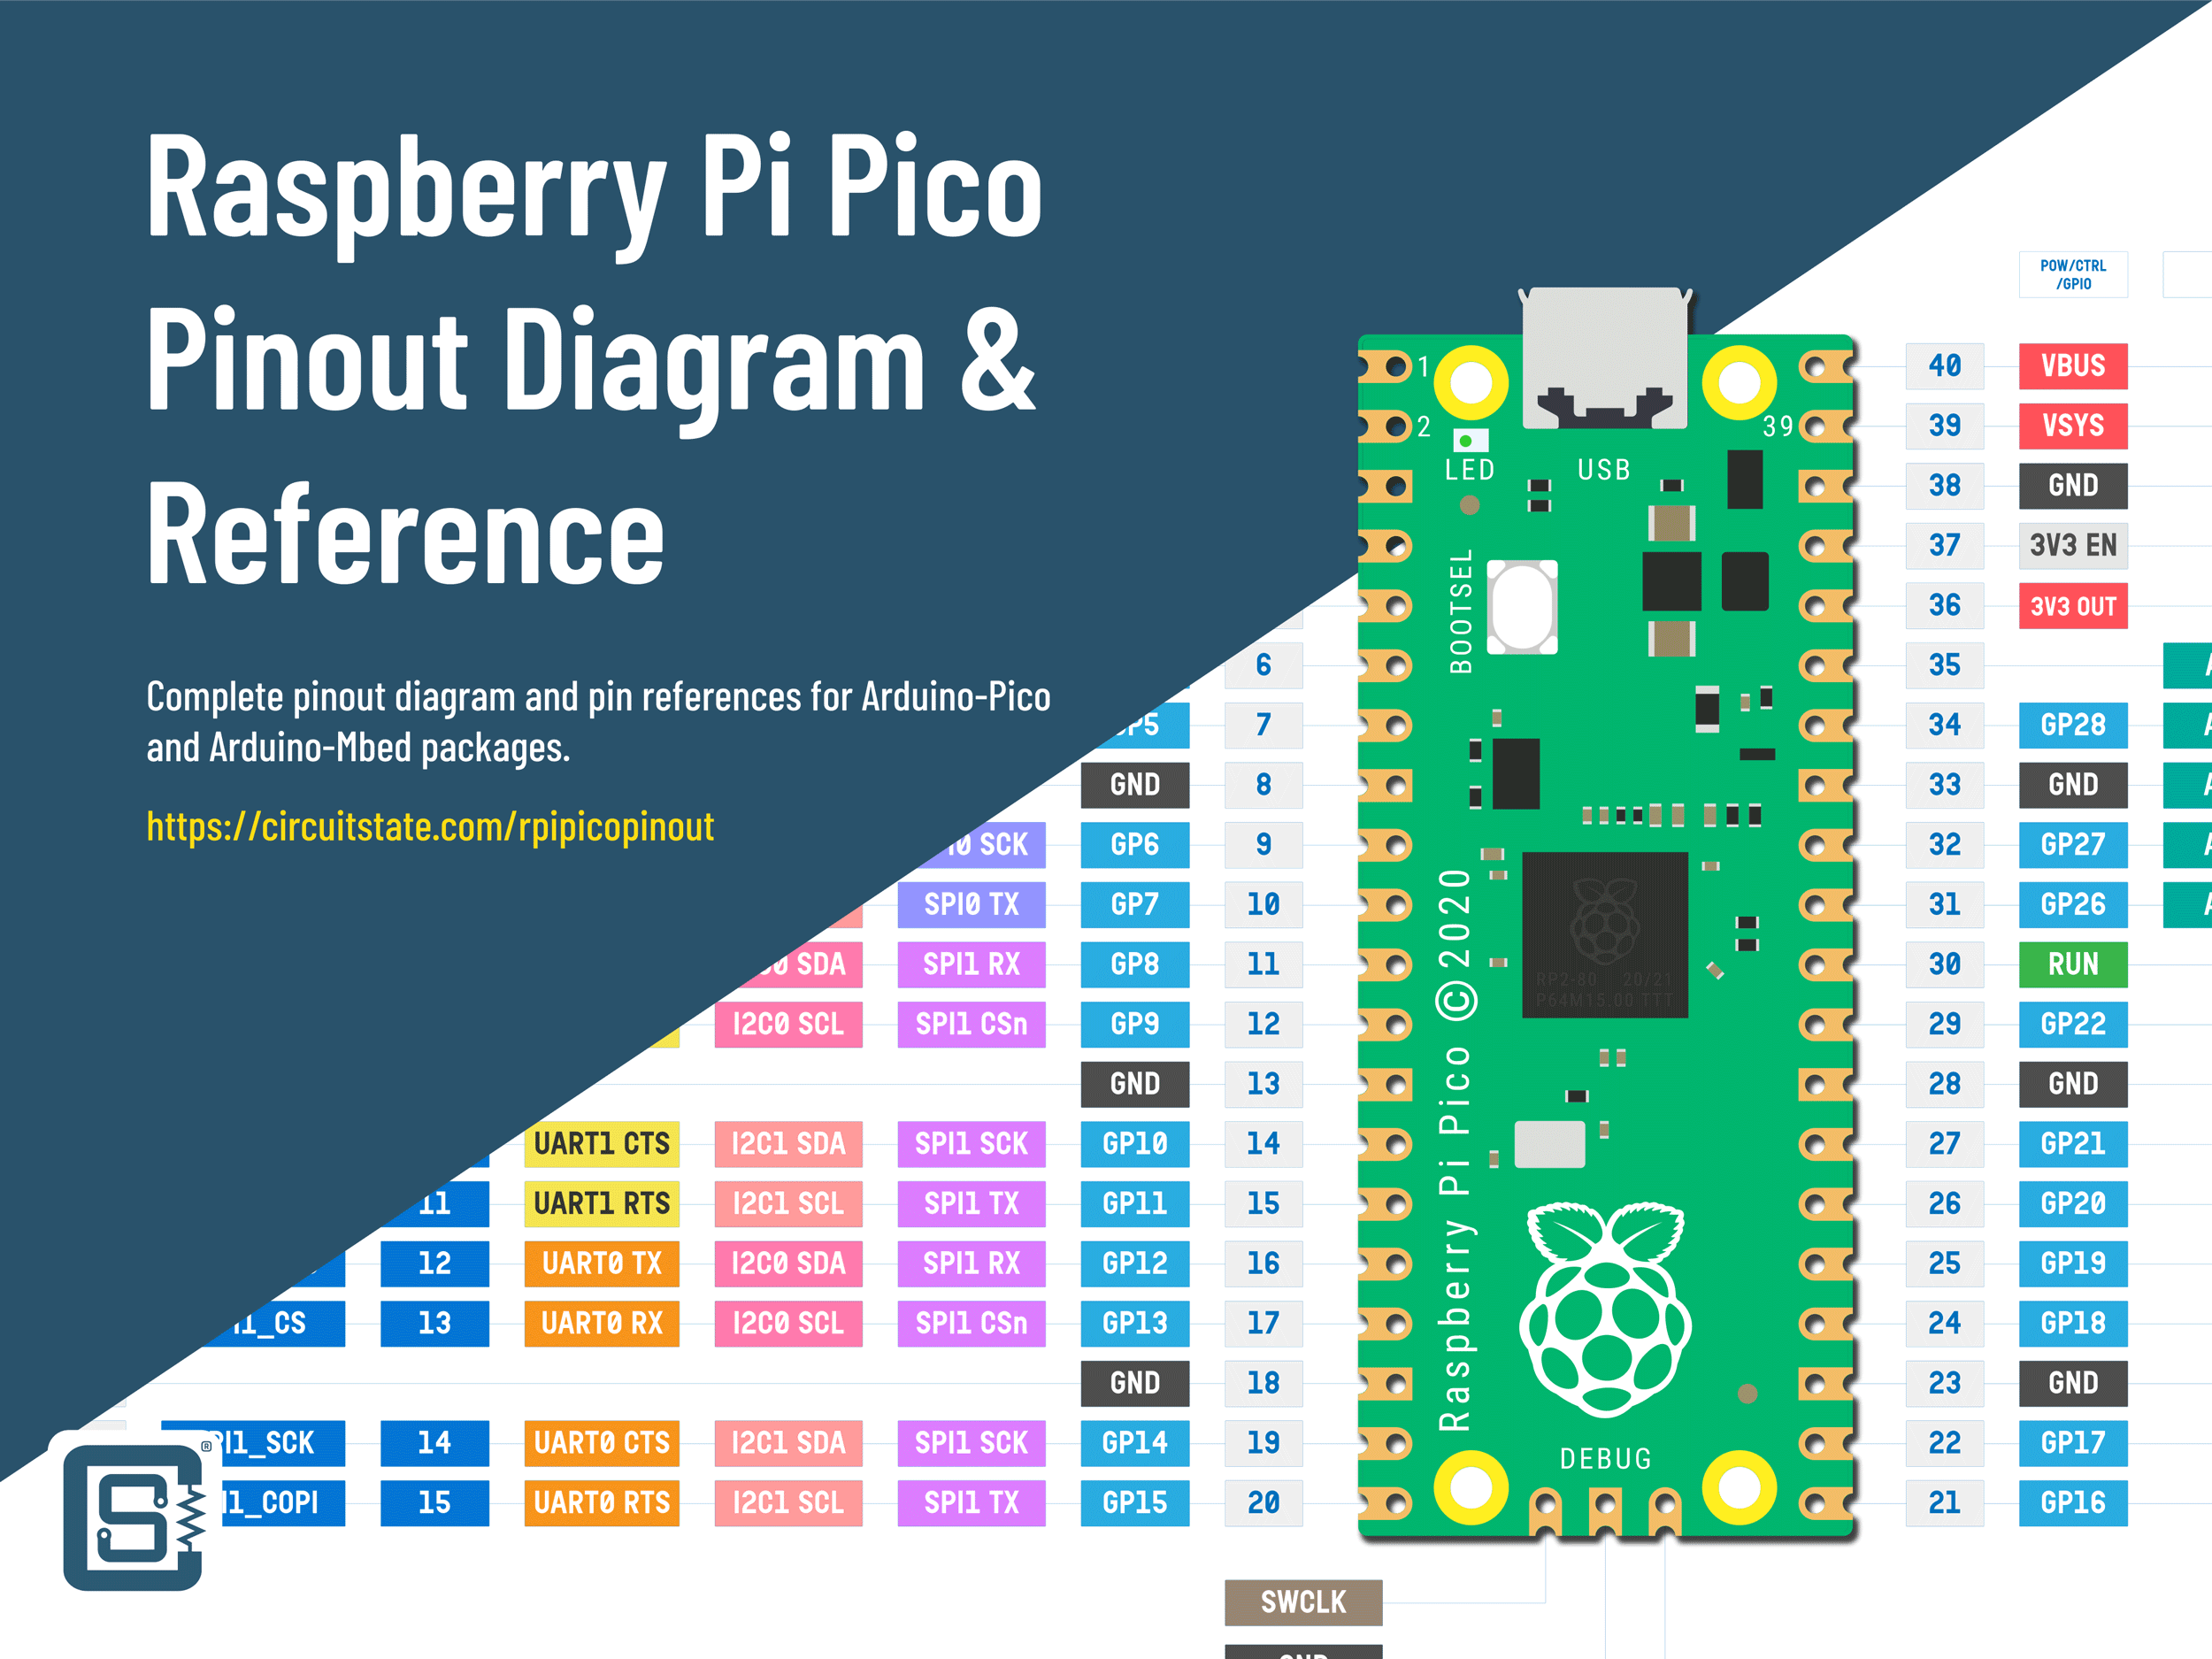
If you need a complete pinout diagram and reference for RP2040 and the Raspberry Pi Pico board, please check out the following post.
Raspberry Pi Pico RP2040 Microcontroller Board – Pinout Diagram & Arduino Pin Reference
CMSIS-DAP
CMSIS-DAP (Common Microcontroller Software Interface Standard – Debug Access Port) is an application firmware used for accessing the CoreSight Debug and Trace Unit found in all ARM Cortex controllers. CMSIS is an open-source unified development framework for ARM microcontrollers. It allows developers to write software that works on all ARM controllers seamlessly irrespective of the chip vendor. Similarly, DAP firmware can communicate with all supported microcontrollers for programming and debugging them. DAP firmware can be adapted to vendor-specific tools easily without using any expensive debugging tools such as J-Link from Segger. However, DAP firmware found on most vendor-specific debug probes is limited to that specific vendor’s products and can not be used for ARM controllers from other vendors.
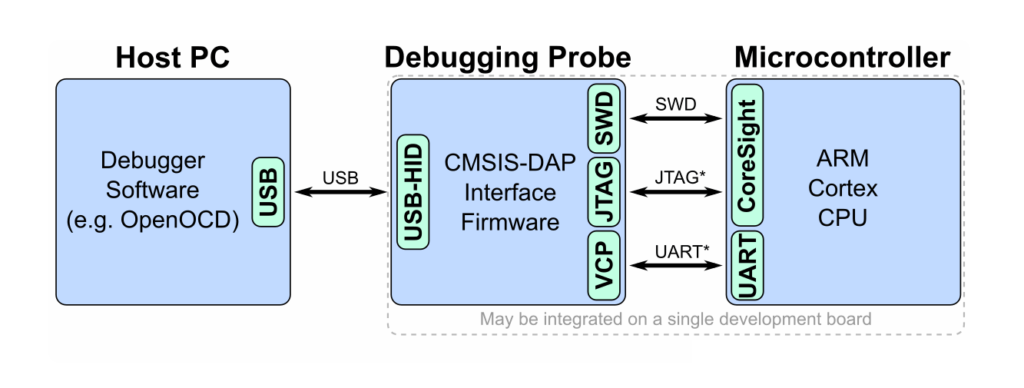
A CMSIS-DAP debug probe comes with a USB for host connection and a JTAG/SWD interface for connecting to the target microcontroller. CMSIS-DAP debug probes can be used for both uploading firmware and debugging. OpenOCD supports CMSIS-DAP debuggers.
OpenOCD
OpenOCD stands for Open On-Chip Debugger and it is a software that was originally created by Dominic Rath that can communicate with the JTAG interface in your microcontroller. OpenOCD is an open-source software and it supports a large variety of debuggers and programmers from different vendors. OpenOCD is a command-line tool and can be invoked from Windows Terminal if installed correctly. You can manually install OpenOCD and add it to the PATH. To check if your system has OpenOCD, you can open the terminal and run the command “openocd”. This will print the version information of OpenOCD if it is present. Otherwise, you will get an unknown command error from the terminal.
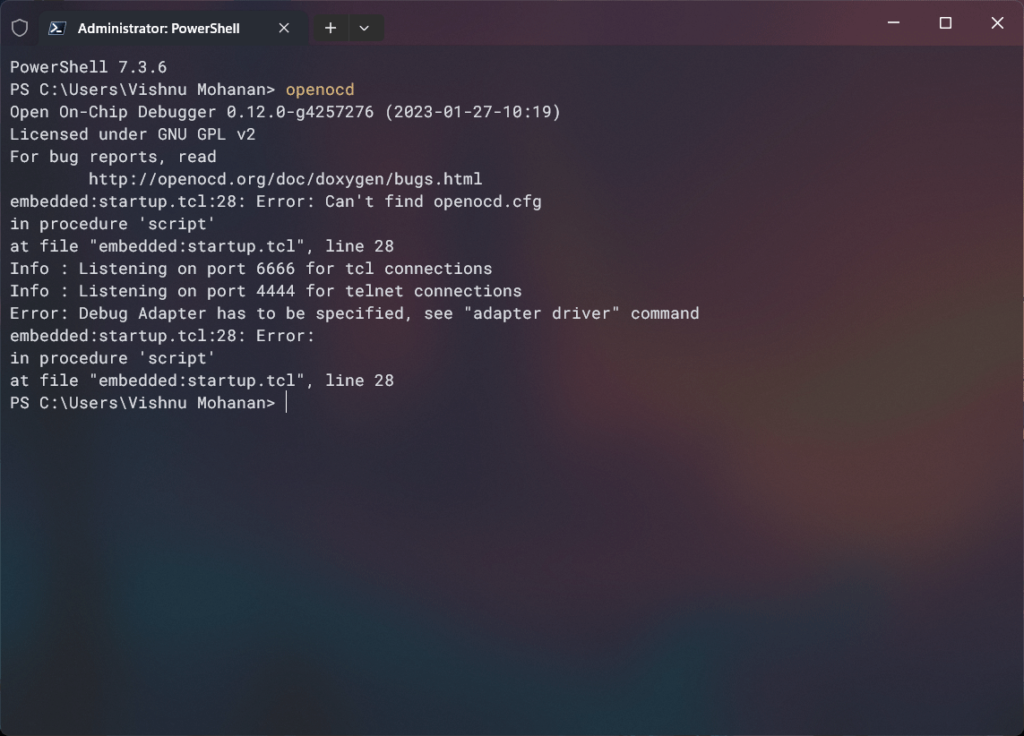
OpenOCD is not a standalone debugger. Its main function is to mediate the communication between a debugger and many types of debug adapters and targets. For the actual debugging to happen, a debugger software should interpret the data output by OpenOCD and give the user the necessary controls for debugging the code. We will use GDB as the debugger for this tutorial. Even though OpenOCD and GDB are essential components for the debugging demo presented in this tutorial, we won’t cover them in detail. We will post dedicated tutorials on both of them in the future.
Installing
Let’s see how you can download and install the latest version of OpenOCD on your Windows system. At the time of wiring this tutorial, the latest stable version of OpenOCD is v0.12.0-2. First, you need to download OpenOCD binary from the GitHub repository. Choose a variant that is supported by your system. We are on Windows 11 64-bit and therefore we are going to install the xpack-openocd-0.12.0-2-win32-x64.zip file. In our case, there is nothing to install. You just need to extract the ZIP file to a place on your system. We have extracted it to the location C:/Apps/ in our system. You can install it anywhere you prefer. We suggest to keep the path short whenever possible.
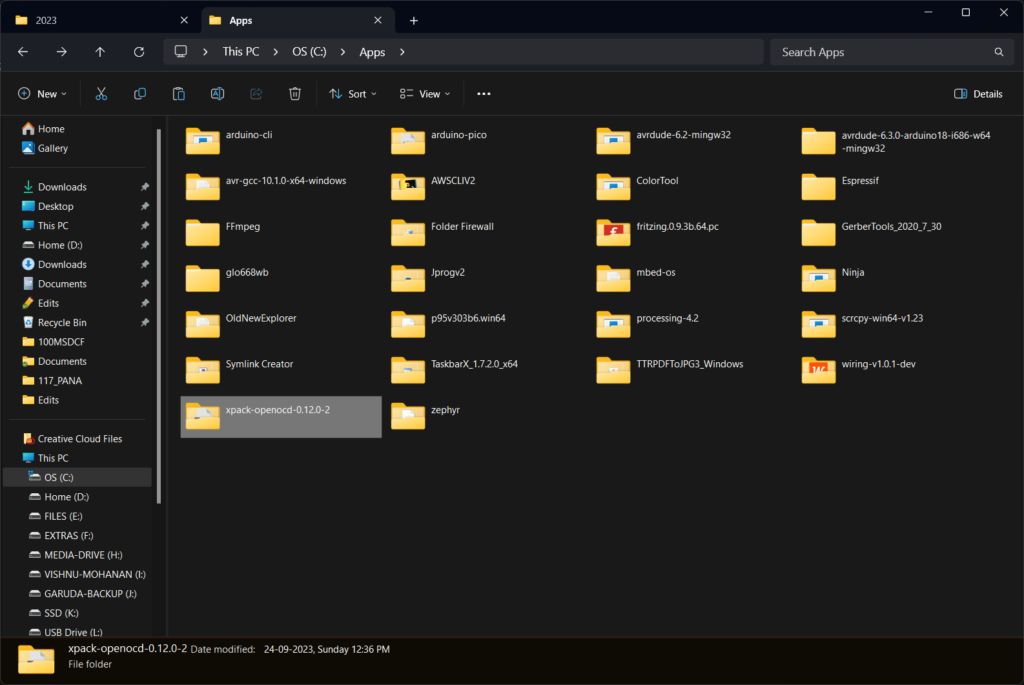
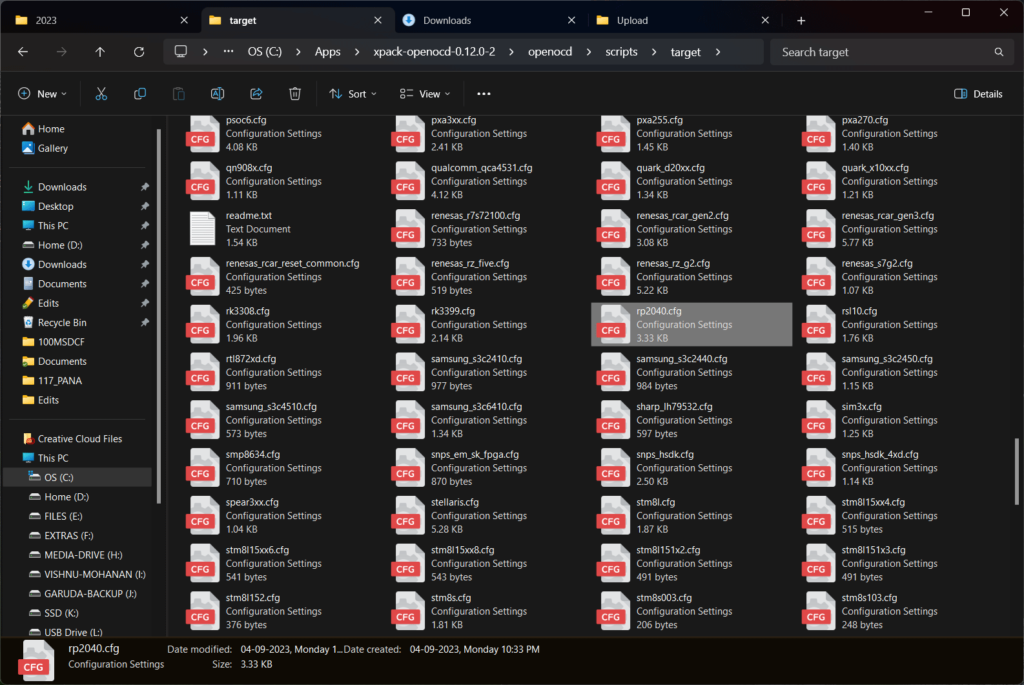
Previsouly, OpenOCD did not support RP2040 as the target and so you had to build your OpenOCD on your own from a supported branch. This is described in the official Pico Debug Probe documentation. But you longer have to do it. OpenOCD version 0.12.0-2 onwards supports the RP2040 microcontroller target as well as the Picoprobe debug probe. The configuration file can be found inside the openocd/scripts/target folder.
# SPDX-License-Identifier: GPL-2.0-or-later

# RP2040 is a microcontroller with dual Cortex-M0+ core.
# https://www.raspberrypi.com/documentation/microcontrollers/rp2040.html

# The device requires multidrop SWD for debug.
transport select swd

source [find target/swj-dp.tcl]

if { [info exists CHIPNAME] } {
	set _CHIPNAME $CHIPNAME
} else {
	set _CHIPNAME rp2040
}

if { [info exists WORKAREASIZE] } {
	set _WORKAREASIZE $WORKAREASIZE
} else {
	set _WORKAREASIZE 0x10000
}

if { [info exists CPUTAPID] } {
	set _CPUTAPID $CPUTAPID
} else {
	set _CPUTAPID 0x01002927
}

# Set to '1' to start rescue mode
if { [info exists RESCUE] } {
	set _RESCUE $RESCUE
} else {
	set _RESCUE 0
}

# Set to '0' or '1' for single core configuration, 'SMP' for -rtos hwthread
# handling of both cores, anything else for isolated debugging of both cores
if { [info exists USE_CORE] } {
	set _USE_CORE $USE_CORE
} else {
	set _USE_CORE SMP
}
set _BOTH_CORES [expr { $_USE_CORE != 0 && $_USE_CORE != 1 }]

swj_newdap $_CHIPNAME cpu -expected-id $_CPUTAPID

# The rescue debug port uses the DP CTRL/STAT bit DBGPWRUPREQ to reset the
# PSM (power on state machine) of the RP2040 with a flag set in the
# VREG_AND_POR_CHIP_RESET register. Once the reset is released
# (by clearing the DBGPWRUPREQ flag), the bootrom will run, see this flag,
# and halt. Allowing the user to load some fresh code, rather than loading
# the potentially broken code stored in flash
if { $_RESCUE } {
	dap create $_CHIPNAME.rescue_dap -chain-position $_CHIPNAME.cpu -dp-id $_CPUTAPID -instance-id 0xf -ignore-syspwrupack
	init

	# Clear DBGPWRUPREQ
	$_CHIPNAME.rescue_dap dpreg 0x4 0x00000000

	# Verifying CTRL/STAT is 0
	set _CTRLSTAT [$_CHIPNAME.rescue_dap dpreg 0x4]
	if {[expr {$_CTRLSTAT & 0xf0000000}]} {
		echo "Rescue failed, DP CTRL/STAT readback $_CTRLSTAT"
	} else {
		echo "Now restart OpenOCD without RESCUE flag and load code to RP2040"
	}
	shutdown
}

# core 0
if { $_USE_CORE != 1 } {
	dap create $_CHIPNAME.dap0 -chain-position $_CHIPNAME.cpu -dp-id $_CPUTAPID -instance-id 0
	set _TARGETNAME_0 $_CHIPNAME.core0
	target create $_TARGETNAME_0 cortex_m -dap $_CHIPNAME.dap0 -coreid 0
	# srst does not exist; use SYSRESETREQ to perform a soft reset
	$_TARGETNAME_0 cortex_m reset_config sysresetreq
}

# core 1
if { $_USE_CORE != 0 } {
	dap create $_CHIPNAME.dap1 -chain-position $_CHIPNAME.cpu -dp-id $_CPUTAPID -instance-id 1
	set _TARGETNAME_1 $_CHIPNAME.core1
	target create $_TARGETNAME_1 cortex_m -dap $_CHIPNAME.dap1 -coreid 1
	$_TARGETNAME_1 cortex_m reset_config sysresetreq
}

if {[string compare $_USE_CORE SMP] == 0} {
	$_TARGETNAME_0 configure  -rtos hwthread
	$_TARGETNAME_1 configure  -rtos hwthread
	target smp $_TARGETNAME_0 $_TARGETNAME_1
}

if { $_USE_CORE == 1 } {
	set _FLASH_TARGET $_TARGETNAME_1
} else {
	set _FLASH_TARGET $_TARGETNAME_0
}
# Backup the work area. The flash probe runs an algorithm on the target CPU.
# The flash is probed during gdb connect if gdb_memory_map is enabled (by default).
$_FLASH_TARGET configure -work-area-phys 0x20010000 -work-area-size $_WORKAREASIZE -work-area-backup 1
set _FLASHNAME $_CHIPNAME.flash
flash bank $_FLASHNAME rp2040_flash 0x10000000 0 0 0 $_FLASH_TARGET

if { $_BOTH_CORES } {
	# Alias to ensure gdb connecting to core 1 gets the correct memory map
	flash bank $_CHIPNAME.alias virtual 0x10000000 0 0 0 $_TARGETNAME_1 $_FLASHNAME

	# Select core 0
	targets $_TARGETNAME_0
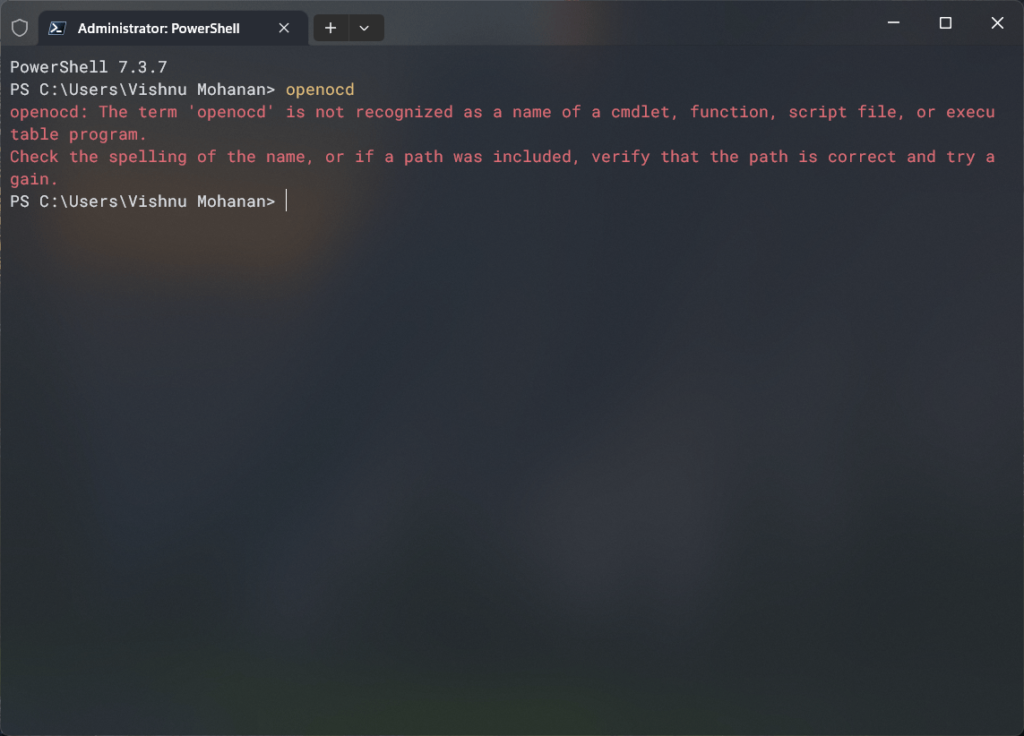
}If you now type openocd on your Windows Terminal, you will see an error. This is because OpenOCD is not yet available in the Path environment variable. Adding OpenOCD to Path is not necessary for this tutorial but adding it can make a few things easier in the long run.
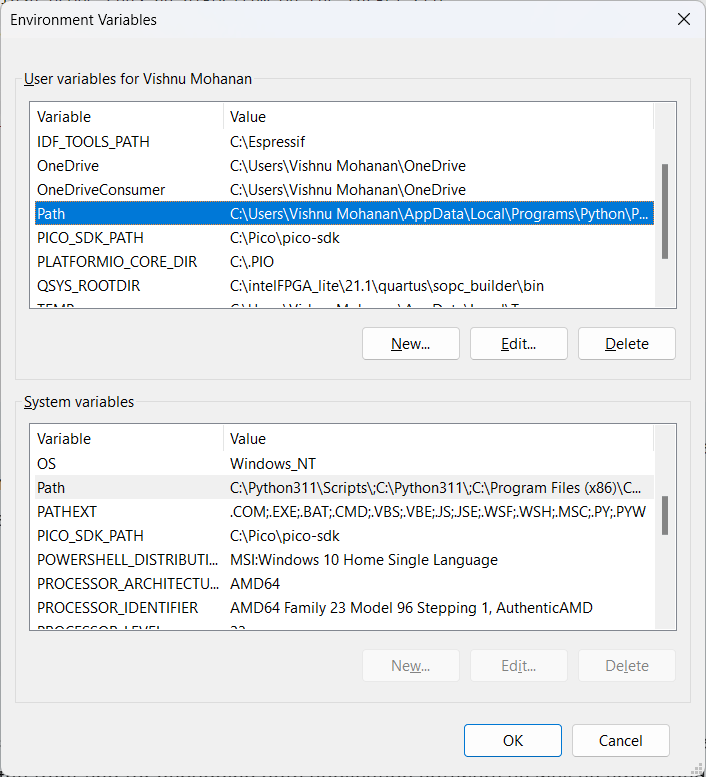
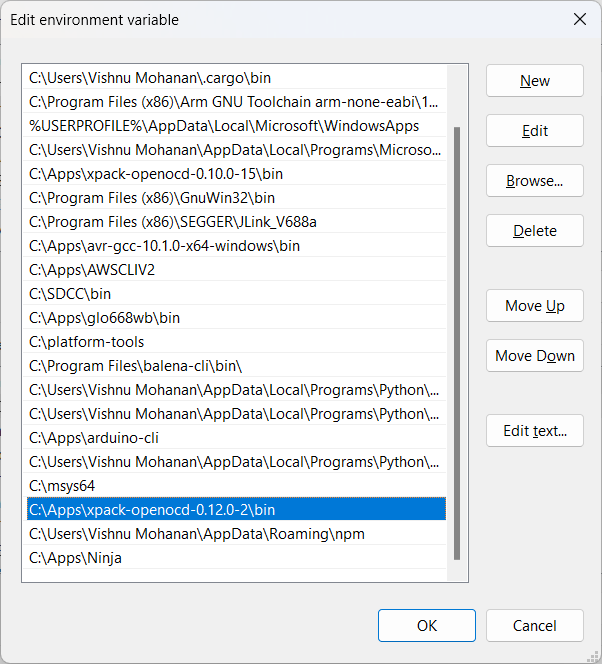
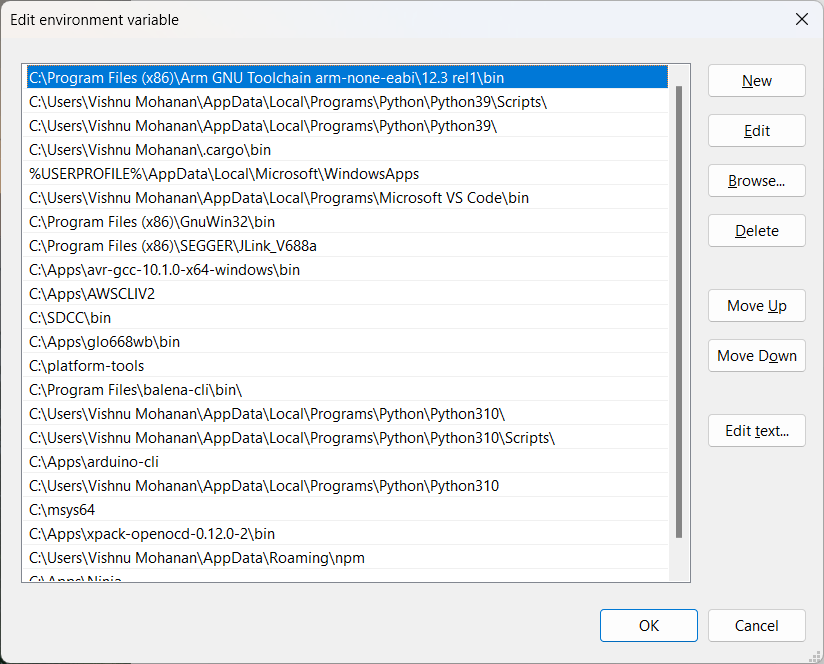
Adding OpenOCD to Path is easy. Simply open the environment variable setting on your Windows and find the Path variable under the user-defined variable section. Click Edit and add the bin folder as a new entry.
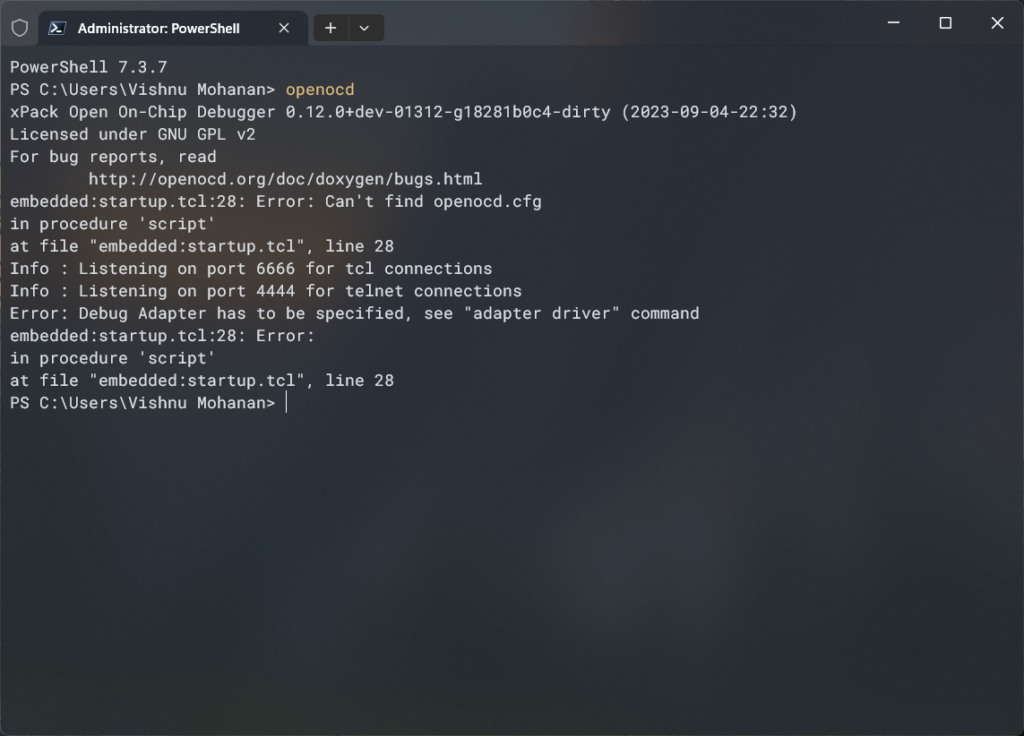
Now if you type the openocd command from Terminal again, you will be able to run the OpenOCD application. Since we did not provide any configuration parameters, OpenOCD is throwing us an error.
GDB
GDB (GNU Debugger) is an open-source debugger software developed by Richard Stallman that is part of the GNU software system. It acts as the front-end for debugging both application software as well as embedded software. GNU can offer native debugging of software targeted for the same hardware GDB is running on, or it can do remote debugging with the actual software running elsewhere. This is how we will incorporate both OpenOCD and GDB in our debugging. OpenOCD can open a GDB server that can accept commands, execute them in the target hardware with the help of a debug adapter, and return the results back to the GDB. To accomplish this GDB must act as a client for remote debugging and communicate with the GDB server opened by OpenOCD.
Installing
GDB for ARM microcontrollers is distributed as part of ARM-GCC compiler suite. You can download the latest version of ARM-GCC from the official ARM website. At the time of writing this, the latest version is 12.3.Rel1. We are downloading the arm-gnu-toolchain-12.3.rel1-mingw-w64-i686-arm-none-eabi.exe file for our Windows 11 PC.
Installing the ARM-GCC toolchain is easy. Just run the installer, agree to the terms, choose an installation path and finally complete the installation. The default installation path is C:\Program Files (x86)\Arm GNU Toolchain arm-none-eabi. You may have other versions of ARM-GCC in the same folder. You can keep them if you need older versions for compatibility.
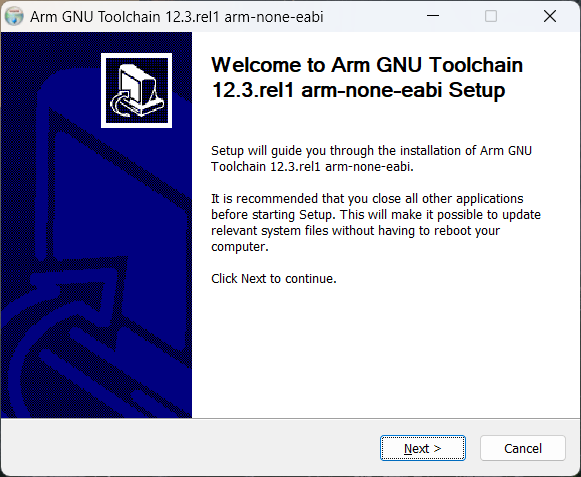
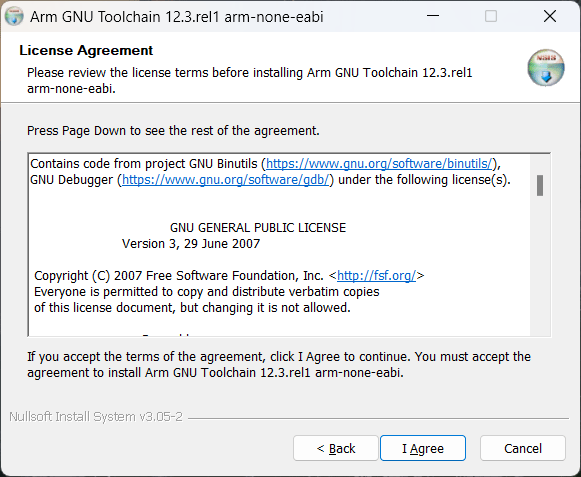
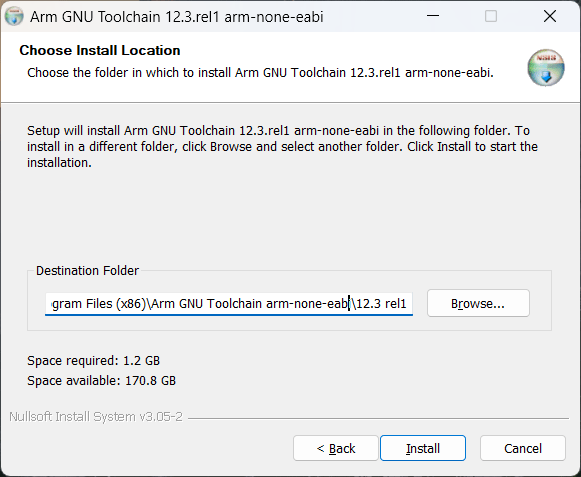
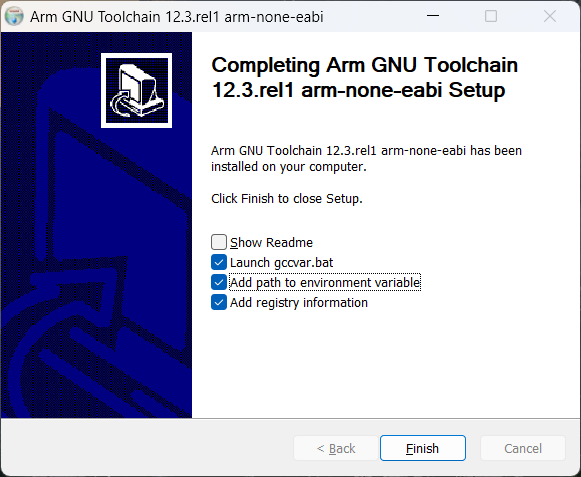
At the end of the installation process keep the checkboxes as shown in the screenshots above. This will automatically ARM-GCC to the Path variable. You can also manually set it. Make sure that the path is correctly specified in the user-defined section of the environment variable. If a path exists in the System Variables section, it will override the user setting. So keep the path to only one section. If you are unable to access the System Variables section of the environment variables, simply run the application as administrator.
Now if you run the following command from Windows Terminal you will get the version information. This confirms that the installation was successful.
arm-none-eabi-gcc --version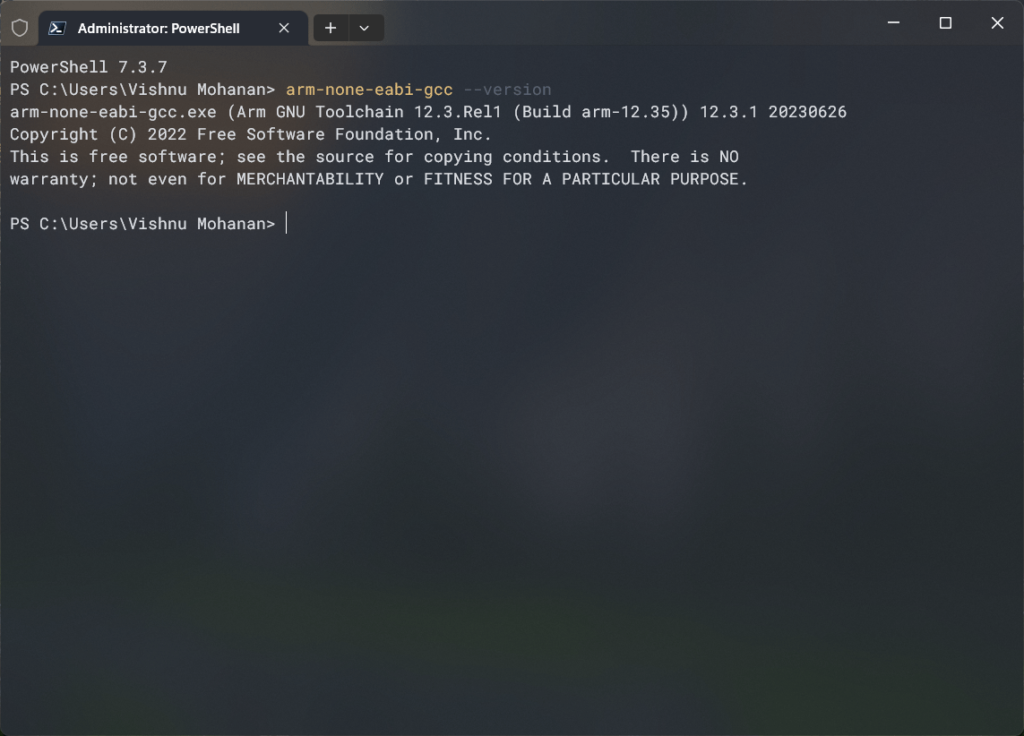
You can also check the GDB version with arm-none-eabi-gdb --version command.
arm-none-eabi-gdb --version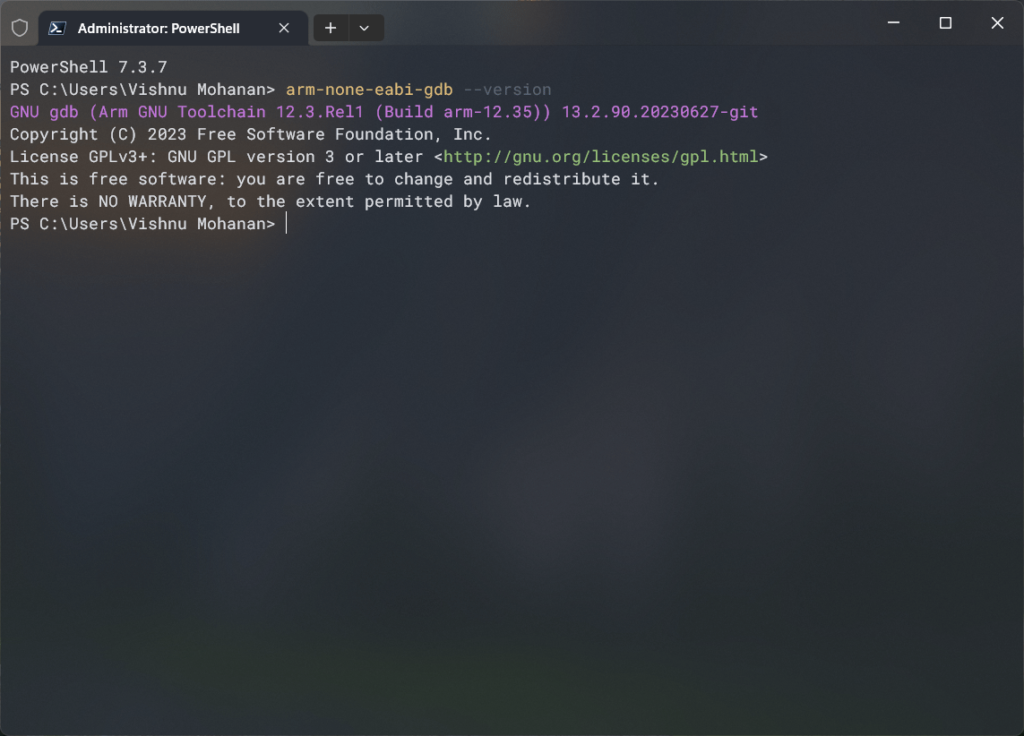
Raspberry Pi Debug Probe
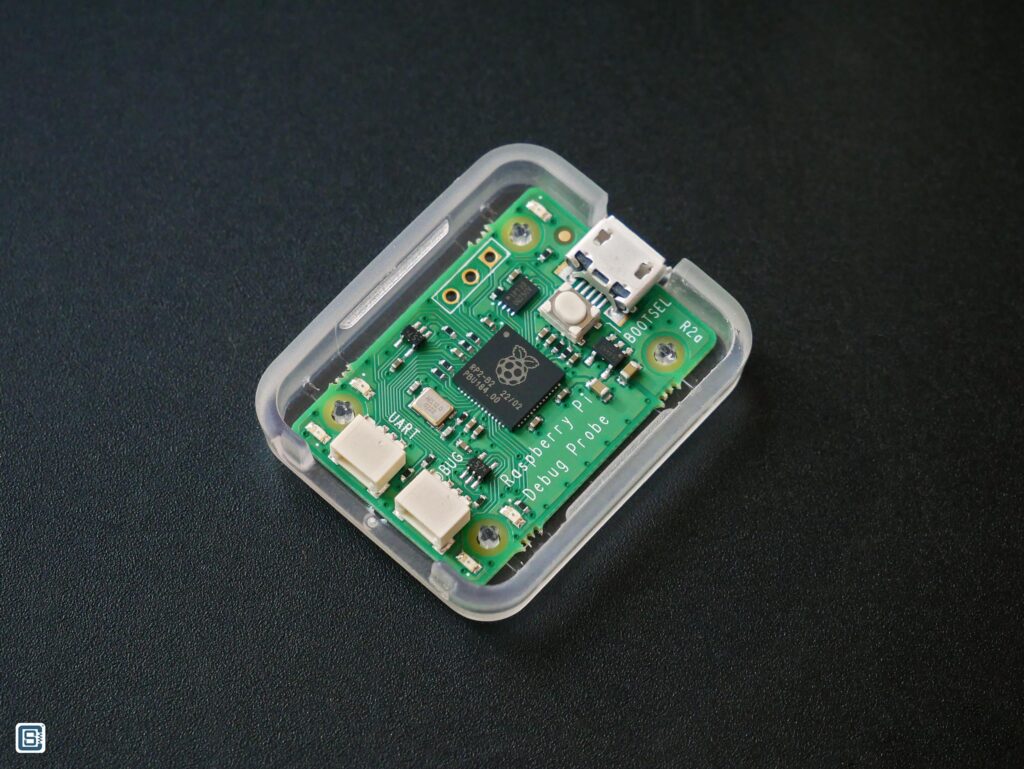
When Raspberry Pi released the RP2040 microcontroller and the Raspberry Pi Pico board on the 21st of January, 2021, they did not come with an official debug probe. You had to use Segger J-Link and other similar expensive tools. It took RPi two years to release an official debug probe on 20th February 2023. But even before that, there were efforts to implement debugging such as the Picoprobe based on CMSIS-DAP. Essentially, you could use one Raspberry Pi Pico to debug another Pico.
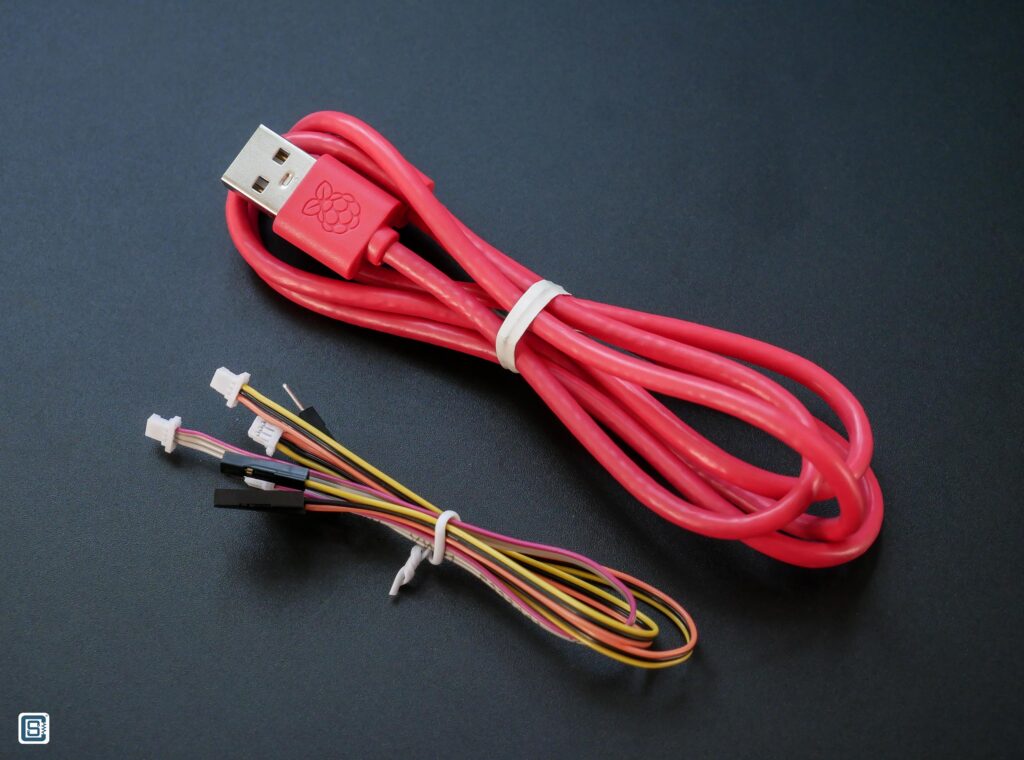
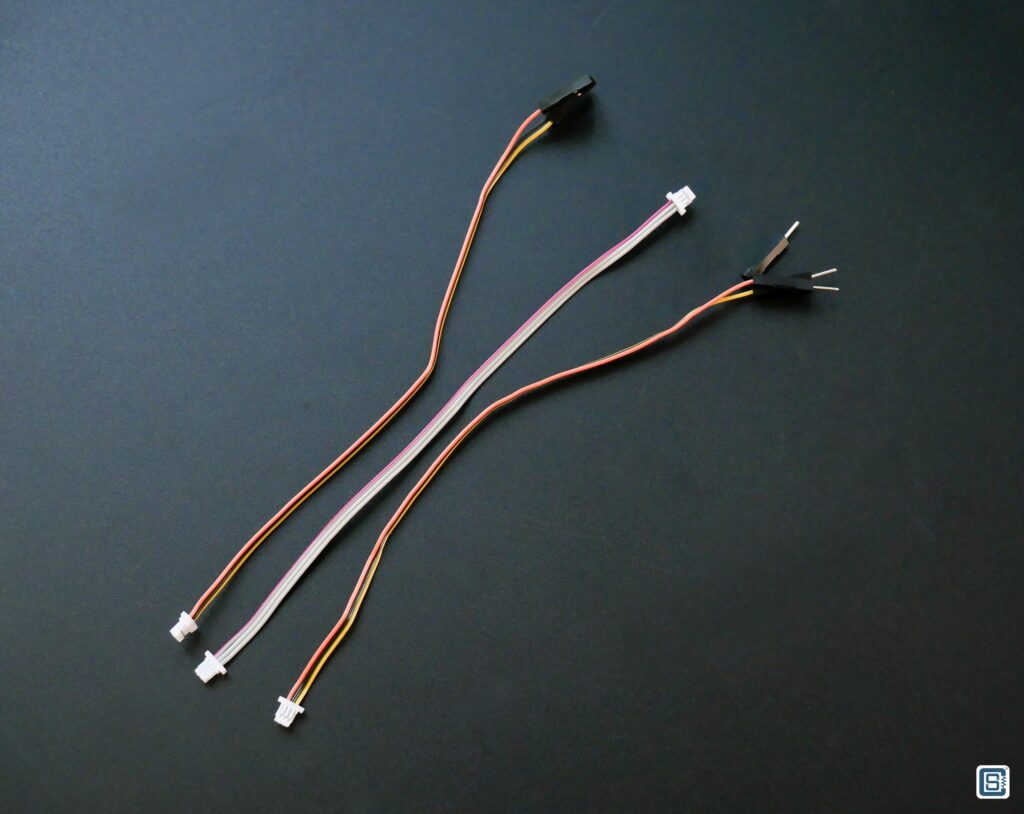
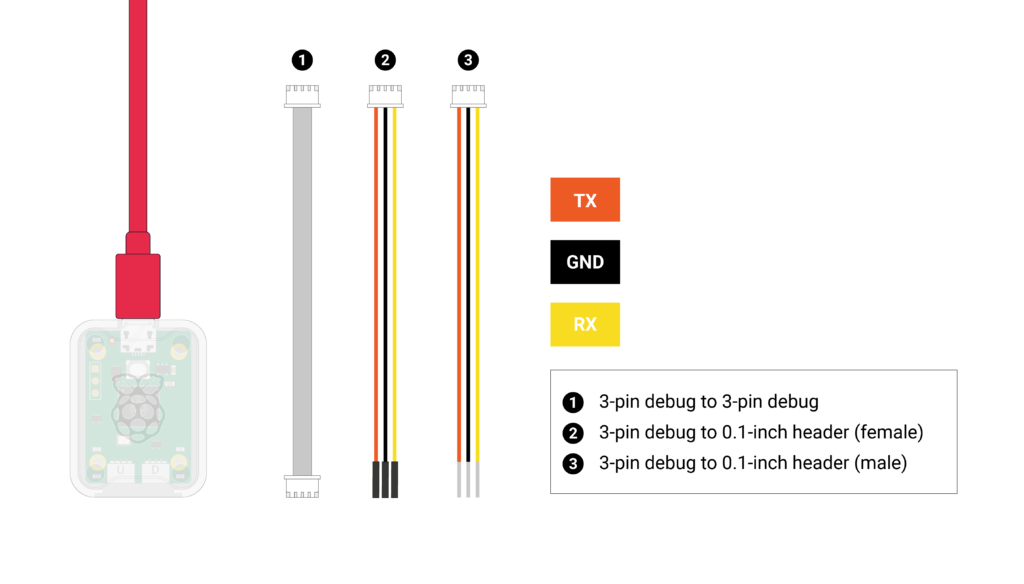
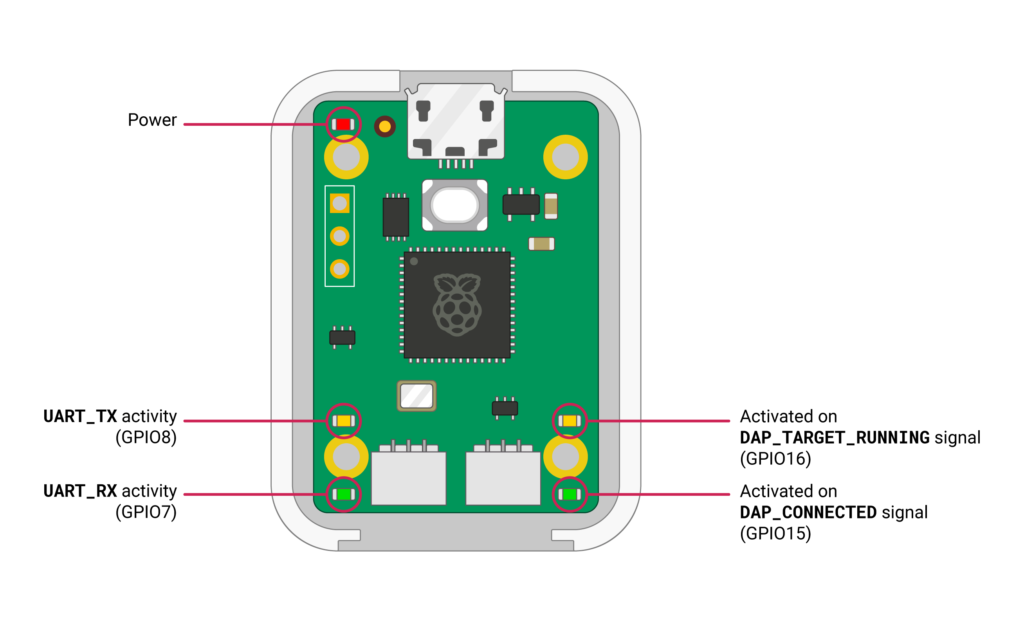
The Raspberry Pi Debug Probe is a dedicated hardware tool based on the Picoprobe firmware. It uses the same RP2040 microcontroller to communicate with a target RP2040 to debug. The Debug Probe exposes one port for SWD and another port for an auxiliary UART port. Both the SWD port and the UART port use 3-pin small JST connectors (SM03B-SRSS-TB). You can use the cables provided in the package to connect to different versions of the Pico board. For example, the Pico H has a JST connector SWD instead of the pin header. The Pico Probe connector interface follows the Raspberry Pi 3-pin Debug Connector Specification.
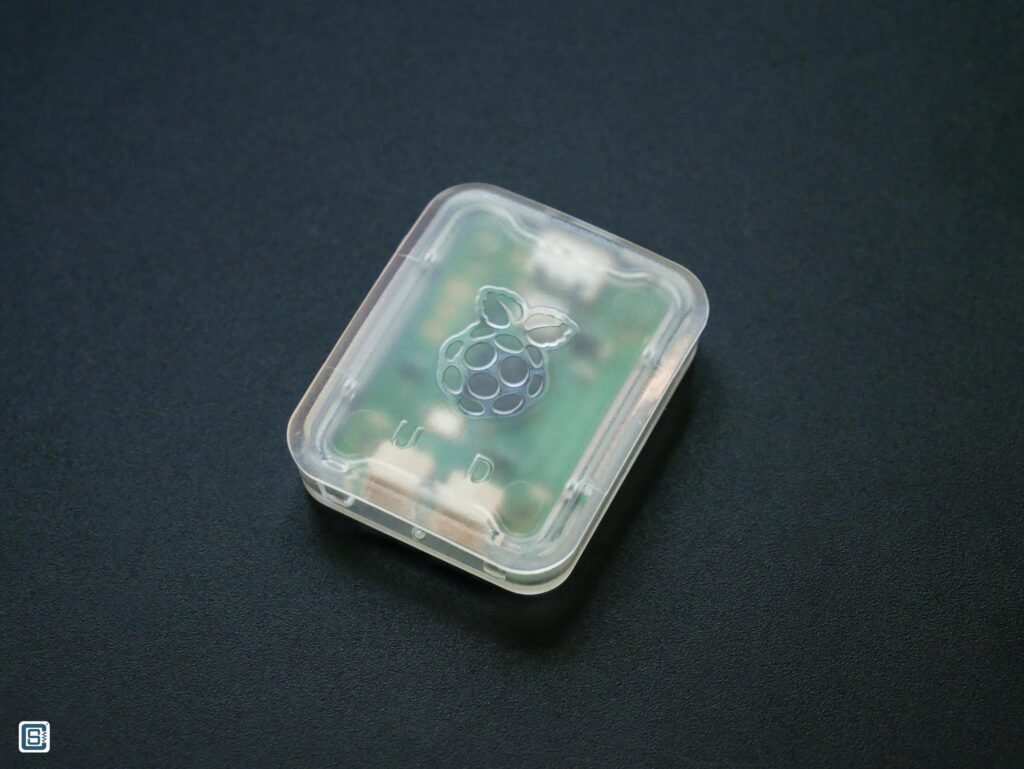
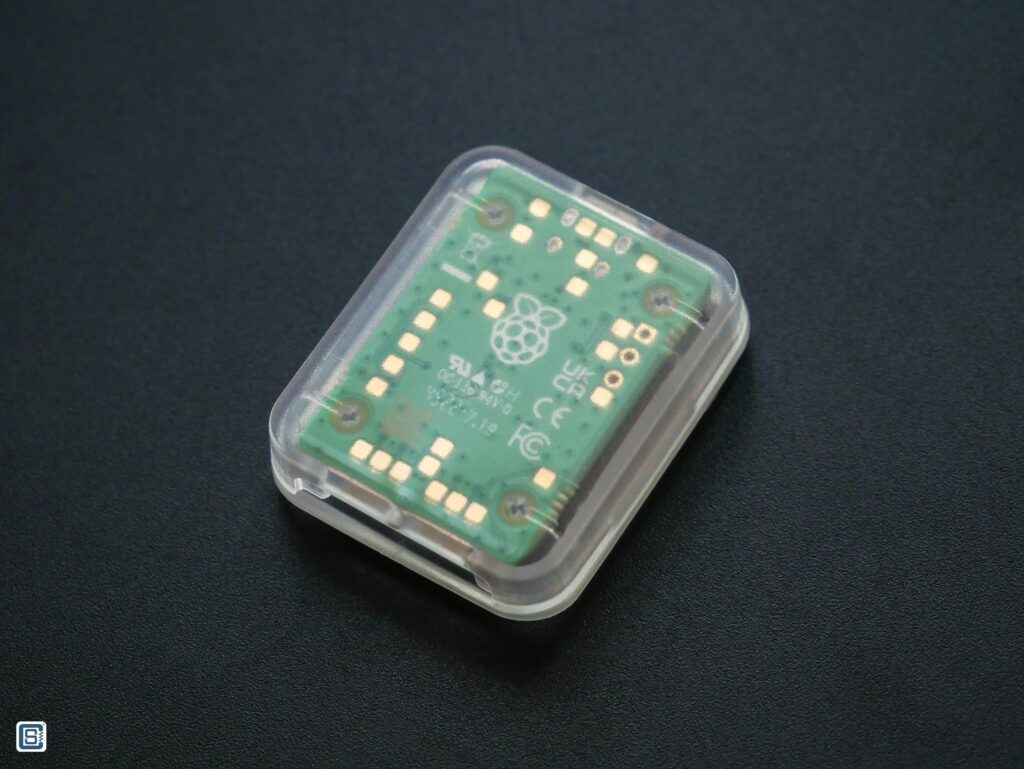
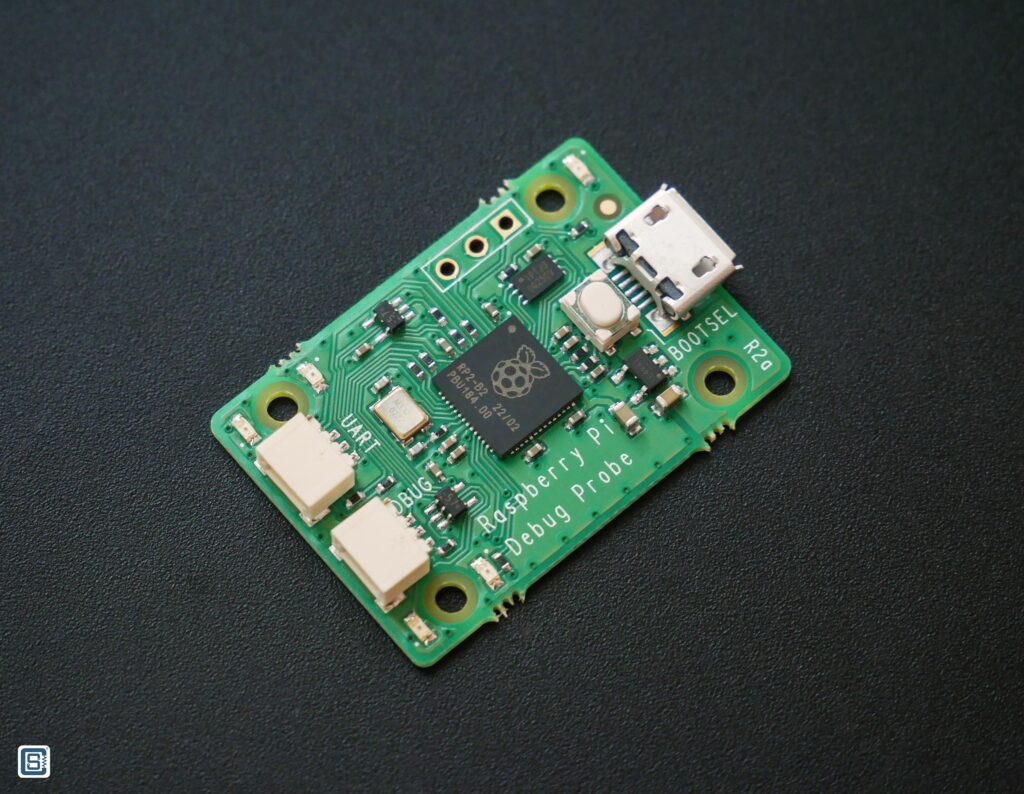
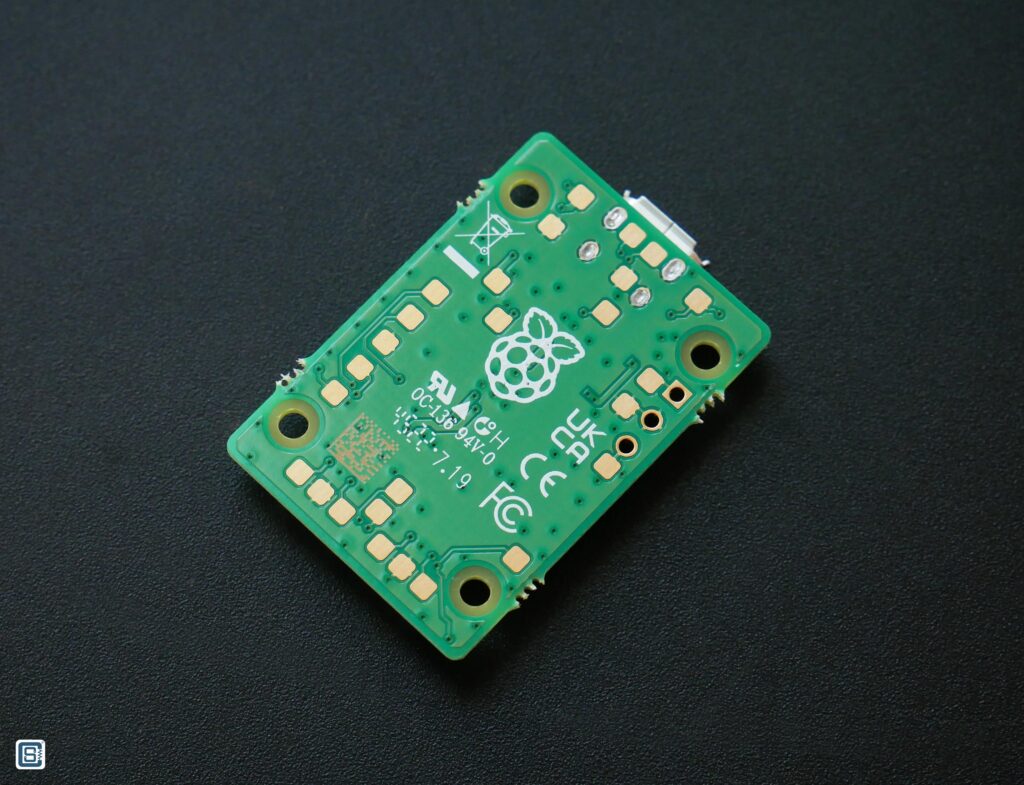
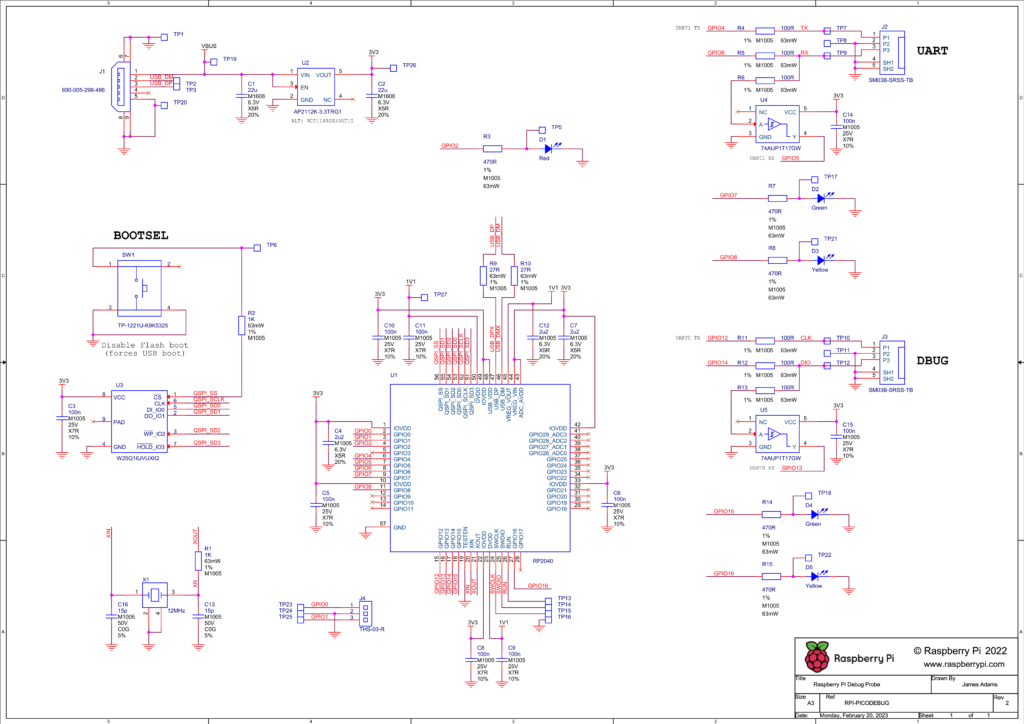
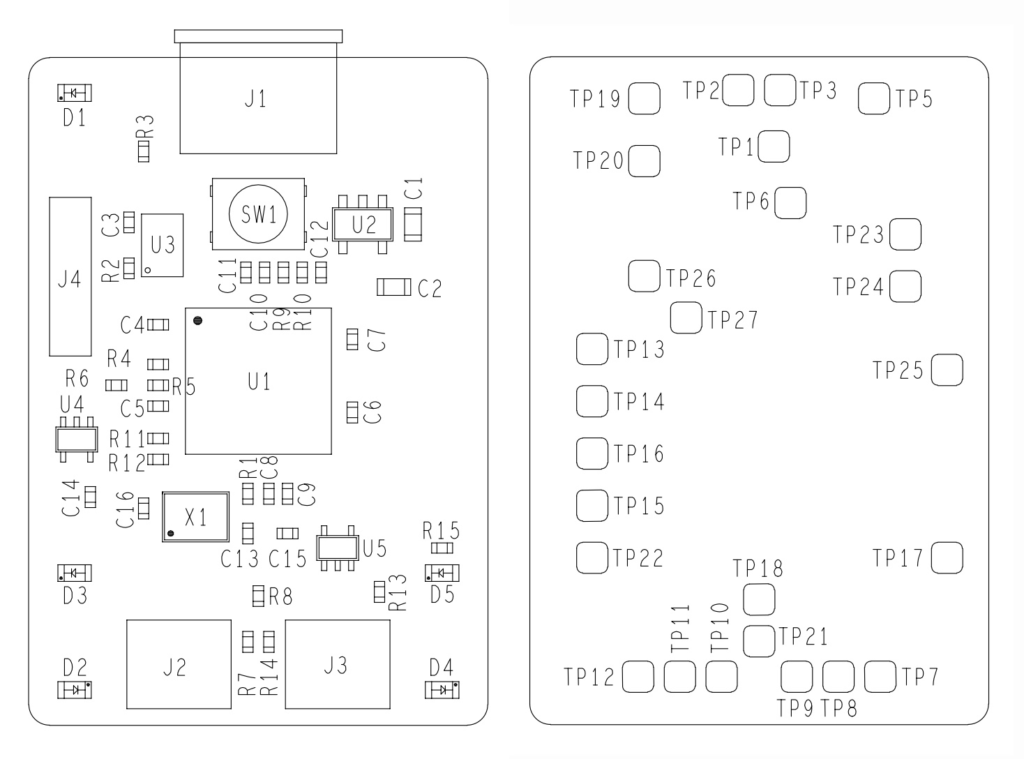
In addition to the JST connectors, the Debug Probe also exposes GPIO0 and GPIO1 of the RP2040. There is also a BOOTSEL button for the RP2040 on the debug probe to update its own CMSIS-DAP firmware. Multiple other signals are broken as test pads and you can find their details on the schematic.
Pinout
Wiring Diagram
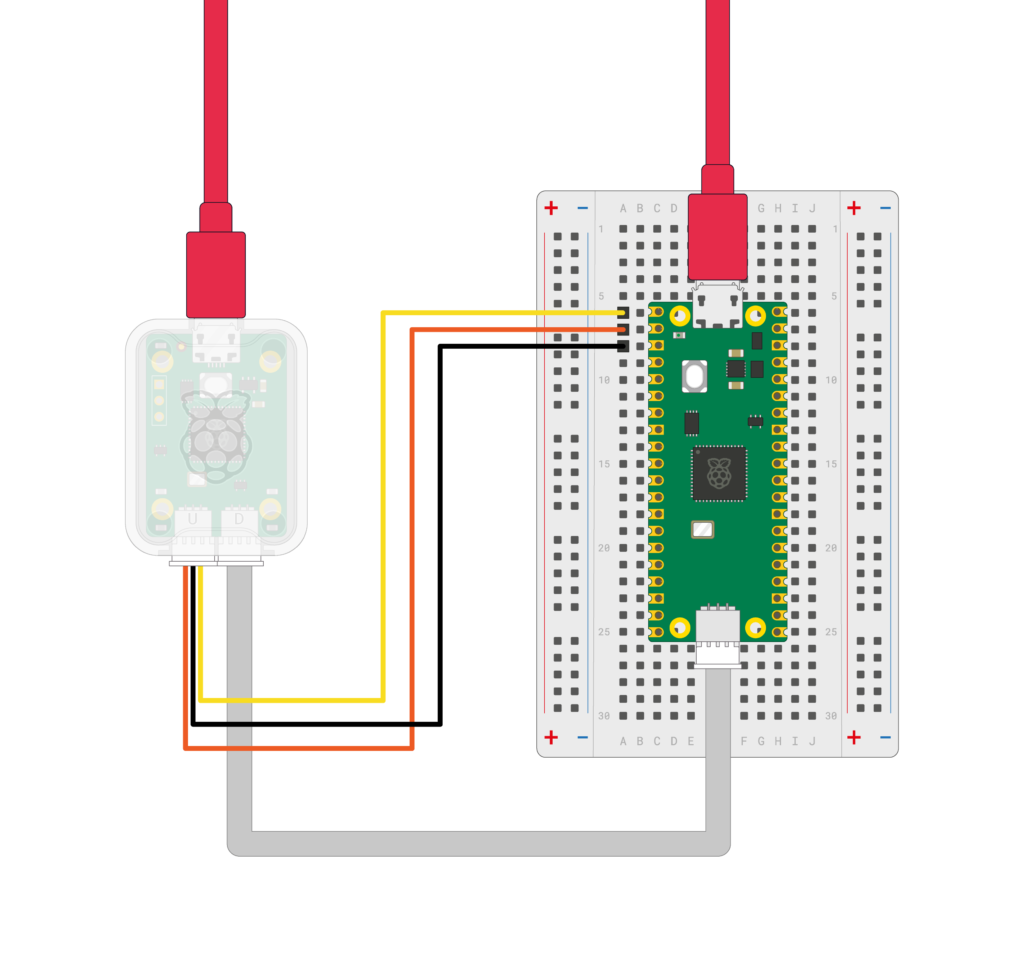
The UART connection is optional here. Since Pico uses the native USB interface for communicating with a computer, the connection is broken every time you upload code. But through the serial port of Pico Debug Probe, you won’t have this issue. It remains always connected and you can direct all your serial debug messages through the UART0 port (or Serial1 port if you are using Arduino).
Schematic
Mechanical Drawing
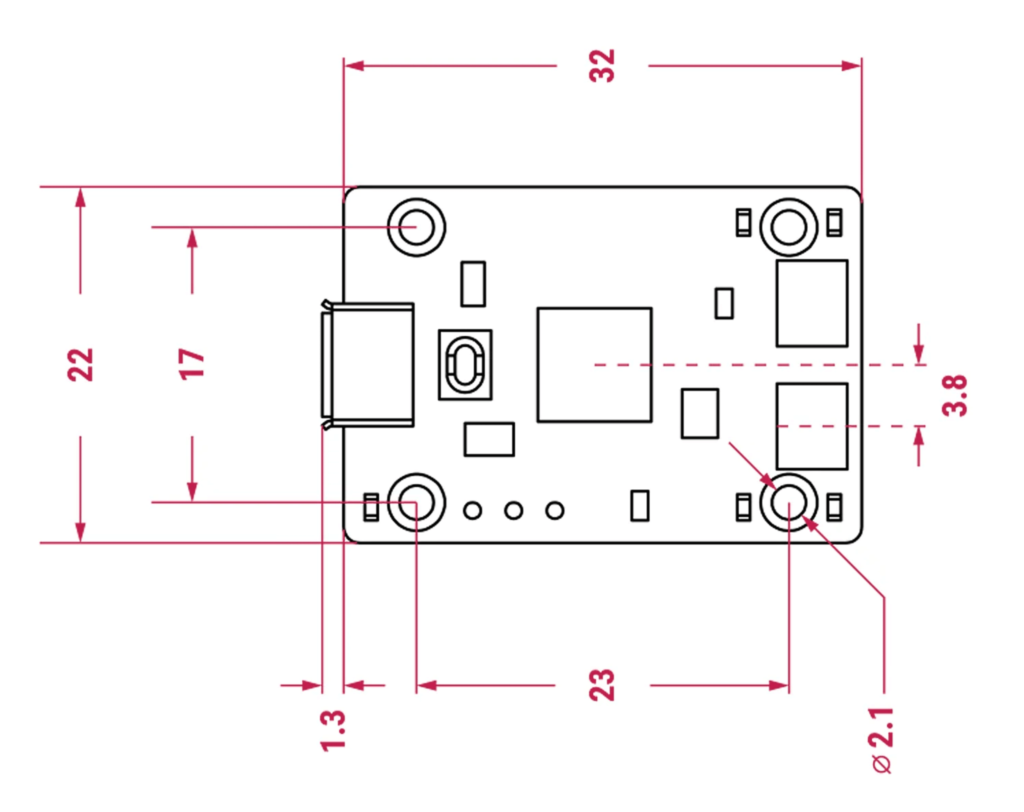
Raspberry Pi Pico Debug Probe mechanical drawing. Source: Raspberry Pi
Installing Driver
When you connect the Debug Probe to your computer, it should create two device instances; one COM port and another CMSIS-DAP v2 interface as you can see from the screenshots below.
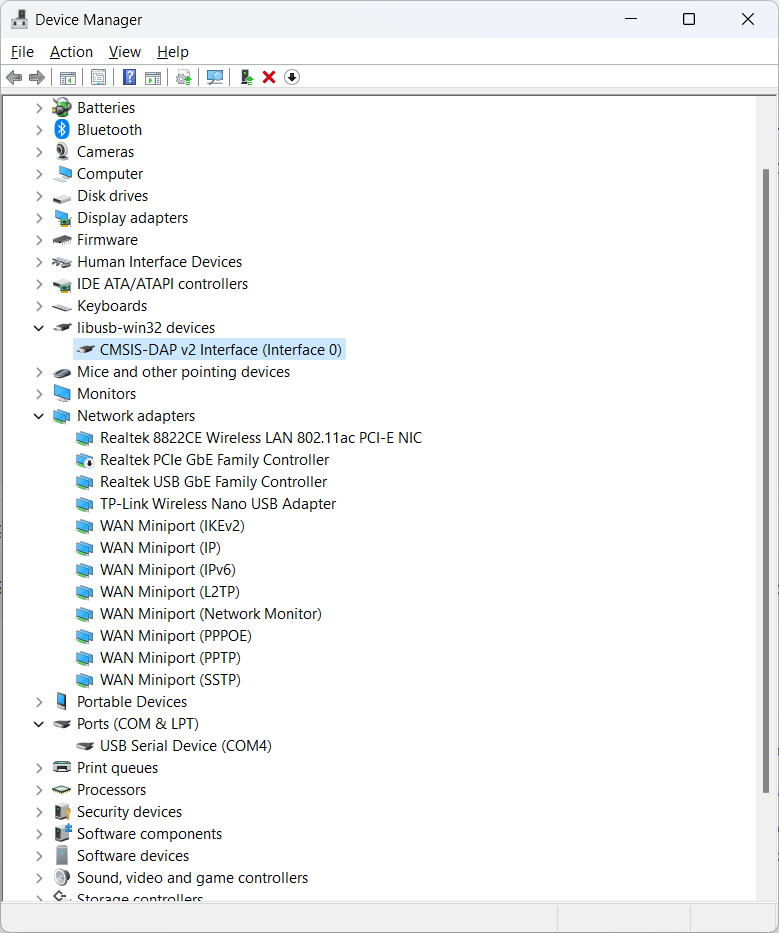
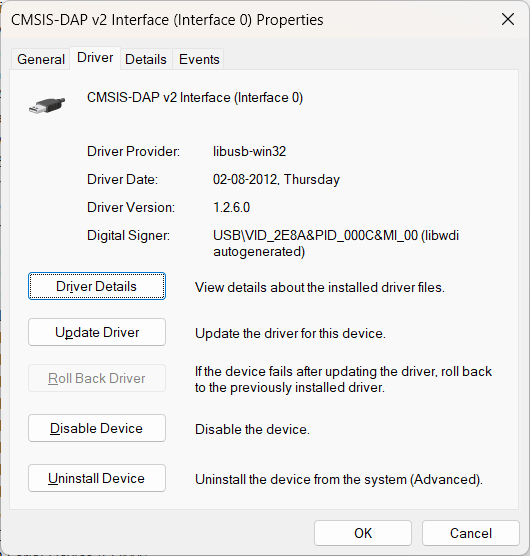
The DAP interface is using the libusb-win32 driver (libusb0 (v1.2.6.0))and the COM port is using the usbser (usbser (v10.0.22621.1830)) driver. If this is not the case and if your system has installed the proper drivers, you can use the Zadig tool to replace the drivers for each of the interfaces with the required ones.
VS Code
Visual Studio Code (VS Code) is a free and open-source IDE (Integrated Development Environment) from Microsoft. It is a cross-platform application that runs on all operating systems and browsers. We will use VS Code and its extensions for this tutorial. If you are new to VS Code, we have a great getting started tutorial for you, where we use the Arduino Nano 33 IoT to demonstrate the features and capabilities of VS Code for Arduino development.
How to Use VS Code for Creating and Uploading Arduino Sketches
VS Code Extensions
To follow this tutorial, you need to install Microsoft Visual Studio Code (VS Code) and the following extensions.
The following extensions are not necessary but are good to have.
Installing the extensions is pretty straightforward. We suggest reading the basic documentation and usage info before proceeding.
Creating Project
For this tutorial, we need to create a standalone C/C++ project for compiling code for the RP2040 microcontroller. We will use the official Pico C/C++ SDK as the toolchain. The Pico SDK already comes with many examples. But the project we are going to create will be external to that. We have already covered this process in a previous tutorial that you can check out.
How to Create A Standalone Raspberry Pi Pico C/C++ Project in Windows and Build from Command-Line and VS Code
Before we get into debugging, we assume that you have installed all the tools necessary and you are able to compile your RP2040 C/C++ projects. We are going to use the following code to blink the on-board LED.
#include "pico/stdlib.h"

int main() {
  const uint LED_PIN = PICO_DEFAULT_LED_PIN;
  gpio_init (LED_PIN);
  gpio_set_dir (LED_PIN, GPIO_OUT);

  while (1) {
    gpio_put (LED_PIN, 1);
    sleep_ms (250);
    gpio_put (LED_PIN, 0);
    sleep_ms (250);
    gpio_put (LED_PIN, 1);
    sleep_ms (250);
    gpio_put (LED_PIN, 0);
    sleep_ms (1000);
  }
}Our CMake file looks like the following.
cmake_minimum_required(VERSION 3.12)

set(CMAKE_C_COMPILER_WORKS)
set(CMAKE_TRY_COMPILE_TARGET_TYPE "STATIC_LIBRARY")

# Import Pico SDK
include(pico_sdk_import.cmake)

project(pico_examples C CXX ASM)
set(CMAKE_C_STANDARD 11)
set(CMAKE_CXX_STANDARD 17)

if (PICO_SDK_VERSION_STRING VERSION_LESS "1.3.0")
        message(FATAL_ERROR "Raspberry Pi Pico SDK version 1.3.0 (or later) required. Your version is ${PICO_SDK_VERSION_STRING}")
endif()

set(PICO_EXAMPLES_PATH ${PROJECT_SOURCE_DIR})

# Initialize the SDK
pico_sdk_init()

include(example_auto_set_url.cmake)
# Add main Folder
add_subdirectory(main)

add_compile_options(-Wall
        -Wno-format          # int != int32_t as far as the compiler is concerned because gcc has int32_t as long int
        -Wno-unused-function # we have some for the docs that aren't called
        -Wno-maybe-uninitialized
        )
Building
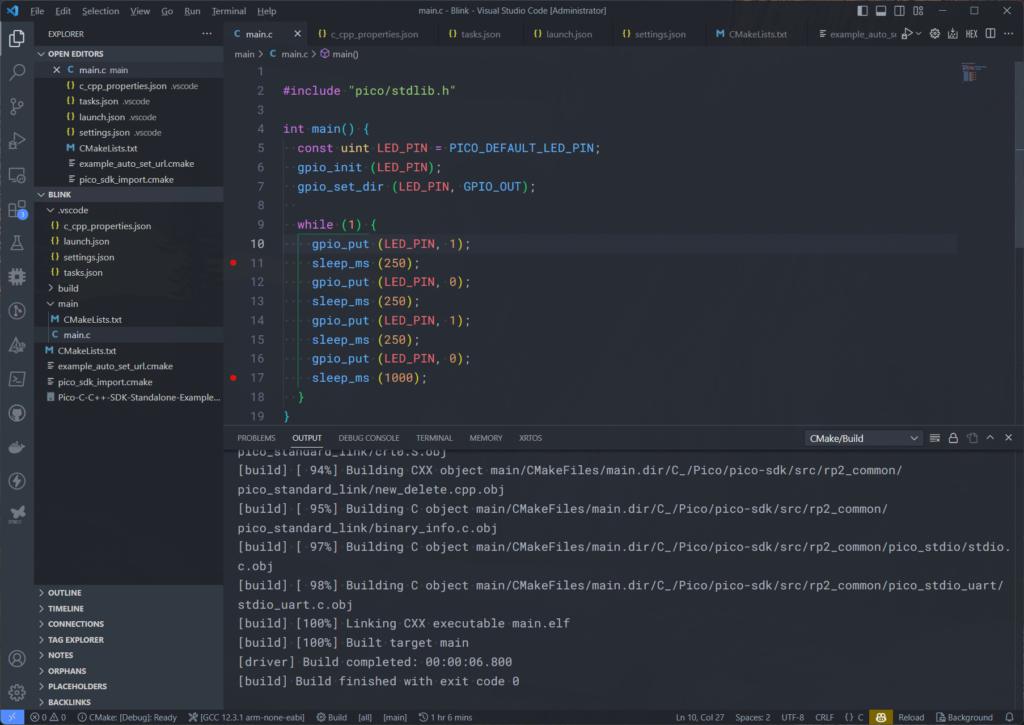
We are using ARM-GCC (arm-gnu-toolchain) version 12.3-Rel1 for building (compiling) this project. Older versions can also compile the RP2040 C/C++ projects just fine. If everything is configured correctly, you should be able to build the project using the Build button on VS Code. The compiled files will be stored inside the build\main directory in the workspace folder.
Uploading
Since the Picoprobe CMSIS-DAP debug probe can be used for both programming and debugging, we can use it to upload the firmware to our RP2040. We can tell OpenOCD to flash the firmware we just compiled using the CMSIS-DAP. You can run the following command on the terminal to do that.
openocd -f interface/cmsis-dap.cfg -f target/rp2040.cfg -c "adapter speed 5000" -c "program build/main/main.elf verify reset exit"We are asking OpenOCD to find the CMSIS-DAP configuration (cmsis-dap.cfg), the RP2040 configuration file (rp2040.cfg) and upload the main.elf file to the target with 5000 bps speed. The main.elf and other binary files are located inside our build\main folder in the root. Since we are running this command from the project workspace folder, OpenOCD is able to find the files without any issues. Following is the upload log from OpenOCD.
 *  Executing task: C:\Apps\xpack-openocd-0.12.0-2\bin\openocd.exe -f interface\cmsis-dap.cfg -f target\rp2040.cfg -c 'adapter speed 5000' -c 'program build/main/main.elf verify reset exit'

xPack Open On-Chip Debugger 0.12.0+dev-01312-g18281b0c4-dirty (2023-09-04-22:32)
Licensed under GNU GPL v2
For bug reports, read
        http://openocd.org/doc/doxygen/bugs.html
Info : Hardware thread awareness created
Info : Hardware thread awareness created
adapter speed: 5000 kHz
Info : Using CMSIS-DAPv2 interface with VID:PID=0x2e8a:0x000c, serial=E6616407E3677429
Info : CMSIS-DAP: SWD supported
Info : CMSIS-DAP: Atomic commands supported
Info : CMSIS-DAP: Test domain timer supported
Info : CMSIS-DAP: FW Version = 2.0.0
Info : CMSIS-DAP: Interface Initialised (SWD)
Info : SWCLK/TCK = 0 SWDIO/TMS = 0 TDI = 0 TDO = 0 nTRST = 0 nRESET = 0
Info : CMSIS-DAP: Interface ready
Info : clock speed 5000 kHz
Info : SWD DPIDR 0x0bc12477, DLPIDR 0x00000001
Info : SWD DPIDR 0x0bc12477, DLPIDR 0x10000001
Info : [rp2040.core0] Cortex-M0+ r0p1 processor detected
Info : [rp2040.core0] target has 4 breakpoints, 2 watchpoints
Info : [rp2040.core1] Cortex-M0+ r0p1 processor detected
Info : [rp2040.core1] target has 4 breakpoints, 2 watchpoints
Info : starting gdb server for rp2040.core0 on 3333
Info : Listening on port 3333 for gdb connections
Warn : [rp2040.core1] target was in unknown state when halt was requested
[rp2040.core0] halted due to debug-request, current mode: Thread
xPSR: 0xf1000000 pc: 0x000000ea msp: 0x20041f00
[rp2040.core1] halted due to debug-request, current mode: Thread
xPSR: 0xf1000000 pc: 0x000000ea msp: 0x20041f00
** Programming Started **
Info : Found flash device 'win w25q16jv' (ID 0x001540ef)
Info : RP2040 B0 Flash Probe: 2097152 bytes @0x10000000, in 32 sectors

Info : Padding image section 1 at 0x10005094 with 108 bytes (bank write end alignment)
Warn : Adding extra erase range, 0x10005100 .. 0x1000ffff
** Programming Finished **
** Verify Started **
** Verified OK **
** Resetting Target **
shutdown command invoked
 *  Terminal will be reused by tasks, press any key to close it.
Your Pico board should be flashing its LED now. To make this process easier, we can add this task to the tasks.json file of VS Code which is located inside the .vscode folder. The tasks file simply configures command-line applications to run with their required parameters. Since OpenOCD is a CLI tool, we can add the uploading process to the tasks using the following configuration.
{
  "version": "2.0.0",
  "tasks": [
    {
      "label": "Upload",
      "type": "shell",
      "command": "openocd",
      "args": [
        "-f", "interface/cmsis-dap.cfg",
        "-f", "target/rp2040.cfg",
        "-c", "adapter speed 5000",
        "-c", "program build/main/main.elf verify reset exit"
      ],
      "problemMatcher": [],
      "group": {
        "kind": "build",
        "isDefault": true
      }
    }
  ]
}
If you already have other tasks present in the tasks.json file, you just need to copy and paste the task configuration within the curly braces. This configuration assumes that OpenOCD is available from the command line globally (through the Path variable). If you want to use a custom OpenOCD executable, simply replace the value of the command value with the complete path to the executable. The task label is “Upload”, and so you will be able to find this task from the Terminal menu with the same name. When you run the Upload task, you will get the same OpenOCD output we saw earlier.
ELF File
An ELF (Executable and Linkable Format) file is a common binary file format used in many operating systems, including Linux and various Unix-like systems. ELF files serve as containers for various types of data, including executable code, shared libraries, and debugging information. When an embedded code is compiled, ELF files are generated to help with remote debugging with tools like GDB. ELF files can also be used as the source files for flashing a microcontroller.
Debugging
Now we can do debugging. To launch a debugging session, we will make use of the Cortex Debug extension. The configuration for debugging can be added to the launch.json file of VS Code. We are going to use the following configuration for this tutorial.
{
  "version": "0.2.0",
  "configurations": [
    {
      "name": "Pico Debug",
      "cwd": "${workspaceRoot}",
      "executable": "${command:cmake.launchTargetPath}",
      "request": "launch",
      "type": "cortex-debug",
      "servertype": "openocd",
      // "serverpath": "C:\\Apps\\xpack-openocd-0.12.0-2\\bin\\openocd.exe",
      "serverpath": "openocd",
      "serverArgs": ["-c adapter speed 5000"],
      "gdbPath": "arm-none-eabi-gdb",
      "device": "RP2040",
      "configFiles": [
        "interface\\cmsis-dap.cfg",
        "target\\rp2040.cfg"
      ],
      "svdFile": "${env:PICO_SDK_PATH}/src/rp2040/hardware_regs/rp2040.svd",
      "postRestartCommands": [
        "break main",
        "continue"
      ],
      "searchDir": [
        "C:\\Apps\\xpack-openocd-0.12.0-2\\openocd\\scripts"
      ],
      "liveWatch": {
        "enabled": true,
        "samplesPerSecond": 4
      }
    }
  ]
}The launch.json file is located inside the .vscode folder. We have a single configuration called “Pico Debug”. Let’s explain what each argument does and its parameters.
name– This is a friendly name for the launch task. This name will appear on the Run and Debug window.cwd– Current Working Directory is the workspace folder path. In this case, we are using the variable${workspaceRoot}to replace the value with whichever workspace is currently opened in VS Code.executable– This tells where the main executable files (ELF, HEX, BIN etc.) are stored. In this case, we replaced it with the${command:cmake.launchTargetPath}which is the path used for saving the build outputs.request– The type of launch request we are making. Can belaunchorattach.type– Indicates the underlying debugger being used. We are using the Cortex Debug extension and thuscortex-debug.serverType– The type of GDB server we are using. Can be supported types are jlink, openocd, pyocd, pe, stlink, stutil, qemu, bmp and external. We are usingopenocd.serverPath– The path to the GDB server application. This can be the complete path to the executable file or a command line argument. Since we can invoke OpenOCD from the command line, we can keep the value toopenocd.serverArgs– This is the list of arguments to the GDB server application. In our case the server is OpenOCD so we can have all arguments here. In this case, we are passing the debug adapter speed of 5000 bps. You can add more arguments by enclosing them in double quotes and separating them with commas.gdbPath– This is the path to the GDB debugger. The value can be a complete path to the executable or be a command line argument.device– The target device ID.configFiles– This is a list of configuration files needed by the debugger application. In our case, OpenOCD requires the debug adapter configuration as well as the target configuration. Both of these files can be found inside the OpenOCD installation directory. If you want to use other configurations, you can add them here.svdFile– System View Description is a format for describing registers of a microcontroller. It can tell a debugger the addresses of the registers and their names. This will help us interpret register data obtained from a debug session easily. For us, the RP2040 SVD file is located inside the Pico SDK installation directory for which we use the${env:PICO_SDK_PATH}environment variable to specify the path.postRestartCommands– Additional GDB Commands to be executed at the end of the restart sequence.searchDir– OpenOCD directories to search for config files and scripts (-s option). If no search directories are specified, it defaults to the configuredcwd. We are specifying the full path of our OpenOCD installation folder here.
You can find more arguments here. We also have a settings.json file to configure a few things.
{
  "cmake.generator": "MinGW Makefiles",
  "cmake.configureEnvironment": {
    "PICO_SDK_PATH": "C:\\Pico\\pico-sdk"
  },
  "files.associations": {
    "stdlib.h": "c"
  },
  "cmake.statusbar.advanced": {
    "debug": {
        "visibility": "hidden"
    },
    "launch": {
        "visibility": "hidden"
    },
    "build": {
        "visibility": "default"
    },
    "buildTarget": {
        "visibility": "default"
    }
},
"cmake.buildBeforeRun": true,
"C_Cpp.default.configurationProvider": "ms-vscode.cmake-tools",
}We are specifying an environment variable for our Pico SDK path using cmake.configureEnvironment. Since we want to use MinGW Makefiles for building Pico SDK tools, it is also there. Using cmake.statusbar.advanced, we are hiding two buttons from the VS Code status bar. Otherwise, you will be confused and persuaded to click them. We don’t need those buttons so we hide them.
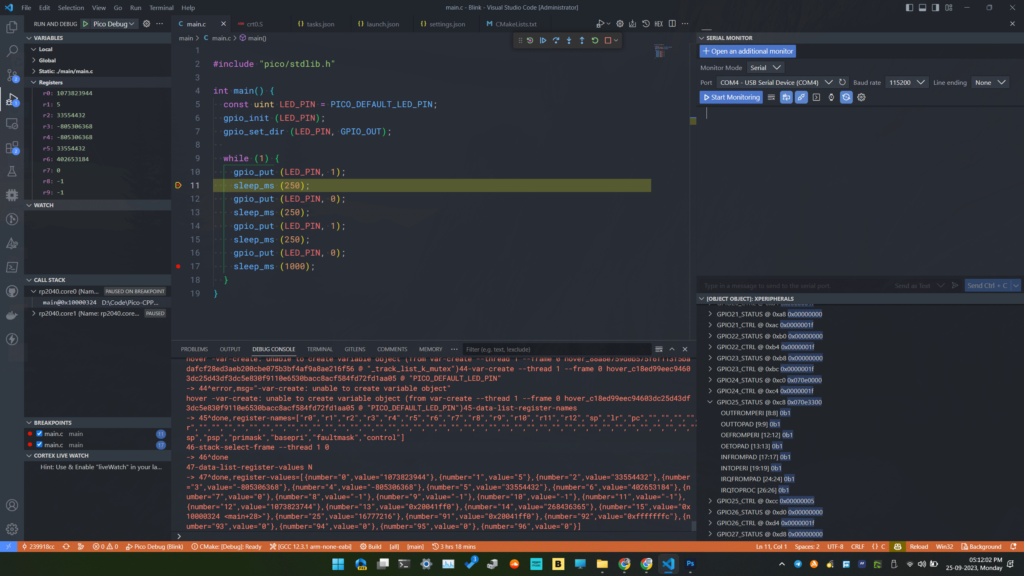
With that, we can start the debugging. Go to the debug tab and click on the green button next to the RUN AND DEBUG option. You can also do Run → Start Debugging. Your code will be compiled in debug mode, OpenOCD will flash the code to the target, reset it, and then start a new GDB server. OpenOCD outputs are printed to the terminal gdb-server and GDB output is printed to the DEBUG CONSOLE window.
Sometimes, starting a debugging session can fail with a message saying,
OpenOCD: GDB Server Quit Unexpectedly. See gdb-server output in TERMINAL tab for more details.
We suspect this happens due to some random lockout of the debug adapter or the target. But you can simply reset the target or reconnect the debug probe to solve this issue for now. If you know the source of the issue, please let us know in the comments.
Breakpoint
A breakpoint is simply the location of an instruction (address of the instruction) in your main code where the debugger will halt/pause the CPU. Breakpoints can be hardware or software types. Hardware breakpoints are faster but limited in number (2-4). Software breakpoints are directly placed in our code as a breakpoint instruction or flag. You can set breakpoints in VS Code by clicking on the breakpoint button corresponding to a line. In our case, the breakpoint is indicated by a red dot next to the line. You can add multiple breakpoints at different locations in your code. A list of all breakpoints set in the code can be found in the BREAKPOINTS section. You can enable and disable individual or all breakpoints from there, without scrolling through the code.
When a breakpoint is reached, VS Code will move the cursor to the line of code where the current breakpoint is situated. If the file is not open, VS Code will automatically open it for you. In the previous screenshot, the breakpoints were located on lines 11 and 17 of our code.
Debug Toolbar

To get the code execution to the set breakpoint, we can use the debug toolbar where there are 6 buttons for controlling debugging.
- Reset Device
- Resets the device
- Resets the device
- Continue
- This runs the code until a breakpoint is found. Since the code is currently paused, clicking this button will resume the execution.
- The keyboard shortcut for this function is F5.
- Step Over
- This progresses the execution to the next line in the code from where it is currently paused.
- Only the lines in the main code are stepped through. Subroutines inside libraries are excluded.
- The keyboard shortcut for this function is F10.
- Step Into
- This takes the debugger to the next line inside any subroutines.
- The keyboard shortcut for this function is F11.
- Step Out
- This will exit any subroutines we have previously entered and get us back to the main code.
- The keyboard shortcut for this function is Shift + F11.
- Restart
- This restarts the debugging from the starting point.
- The keyboard shortcut for this function is Ctrl + Shift + F5.
- Stop
- This stops the debugging session.
- The keyboard shortcut for this function is Shift + F5.
Variable Inspection
Just pausing the CPU on some lines of code won’t be of much use. You need to be able to check the values of the variables, hardware registers, and other memory locations. You can do that with the VARIABLES section. It will list all the global and local variables available in the current scope and their values. If you want to monitor a particular variable, you can add that to a watch list shown by the WATCH section.
In addition to viewing the variable values, you can also change their values manually. You can right-click on a variable on the VARIABLES list and use the Set Value option to set a new value to the variable. This will have an immediate effect on your code.
Call Stack
The next thing you can observe on the IDE is the CALL STACK which lists the chain of function calls, their addresses, locations in the file, and states. You can individually step through the functions if needed.
Register Inspection
If you want to see the values of the internal hardware registers of RP2040, you can find them in the Registers section under VARIABLES. This only contains the CPU-related registers. Registers related to the peripherals can be found in the XPERIPHERALS section. The peripheral registers are updated automatically whenever there is a change. A correct SVD file should be specified for this to work.
Live Watch
The Cortex Debug extension allows you to monitor variables without interfering with or stopping the code at breakpoints. You can enable the Live Watch feature in the launch.json file. When Live Watch is enabled, you can add a new variable to watch by simply adding the variable name by pressing the + button on the CORTEX LIVE WATCH section. The variable should be global for this to work. As your code runs, you can see the value of the variable changes. The frequency of the variable update can also be set in the configuration.
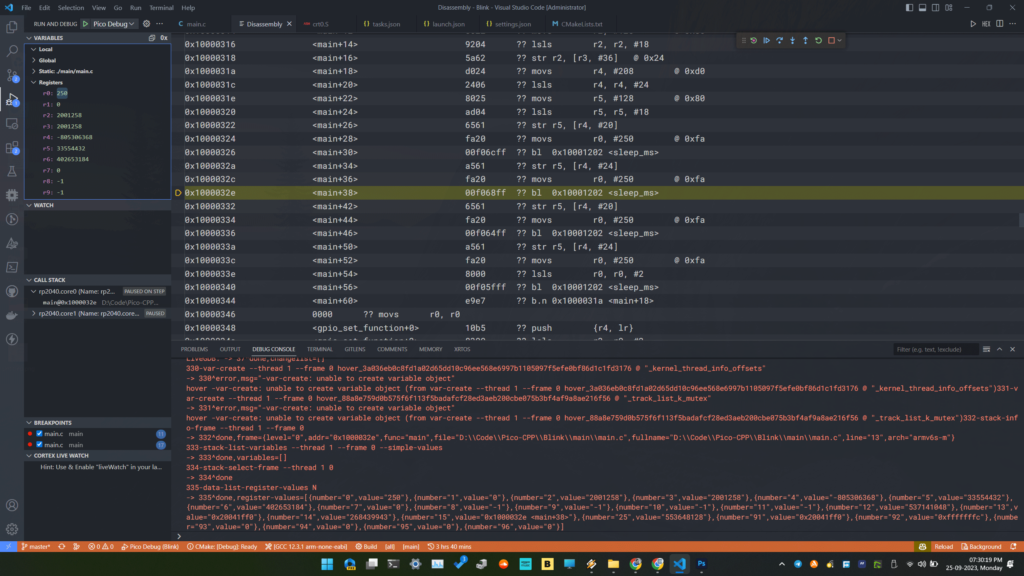
Assembly View
You can view the disassembly view by executing Open Disassembly View from the VS Code Command Palette. This will open the assembly file instructions and you can step through them if you like.
Flash Dump
You can use the Debug Console to execute GDB commands. To save the contents of the flash memory you can use the following command while the debug session is active. The starting address of the flash memory is 0x10000000 according to the RP2040 datasheet. So if you have 2 MB of flash memory, the end address would be 0x10200000. This will save the flash contents as a binary file named flash_dump.bin with a file size of 2 MB to the workspace folder. If saved correctly, the file will have the same contents as the main.bin generated during building.
dump binary memory flash_dump.bin 0x10000000 0x10200000It takes around 30 seconds to save the flash contents if the adapter speed (debug_speed) is 10000 bps. The maximum speed you can safely use is 30000 bps as per our tests. Above that, the DAP will fail to initialize.
Memory View
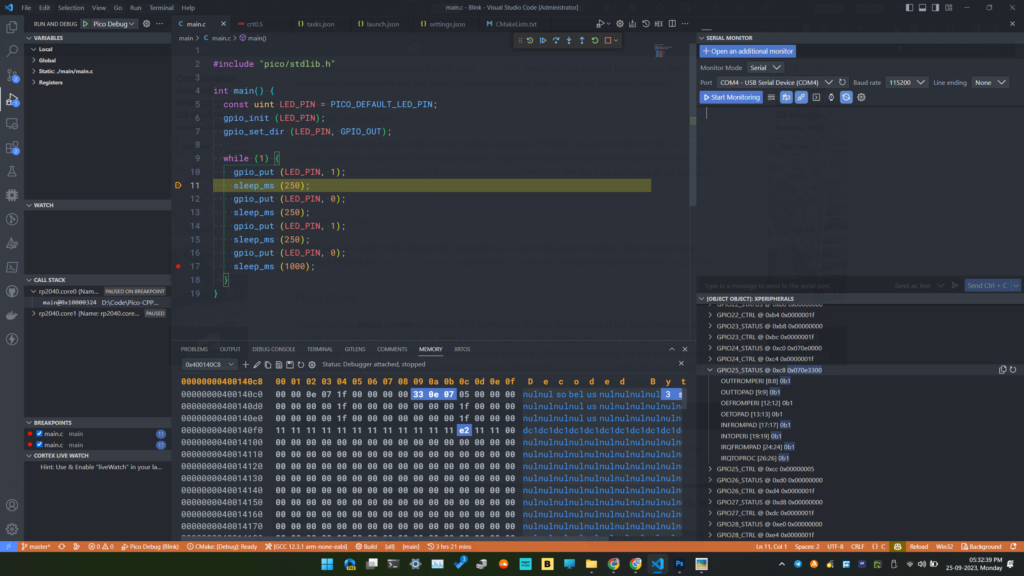
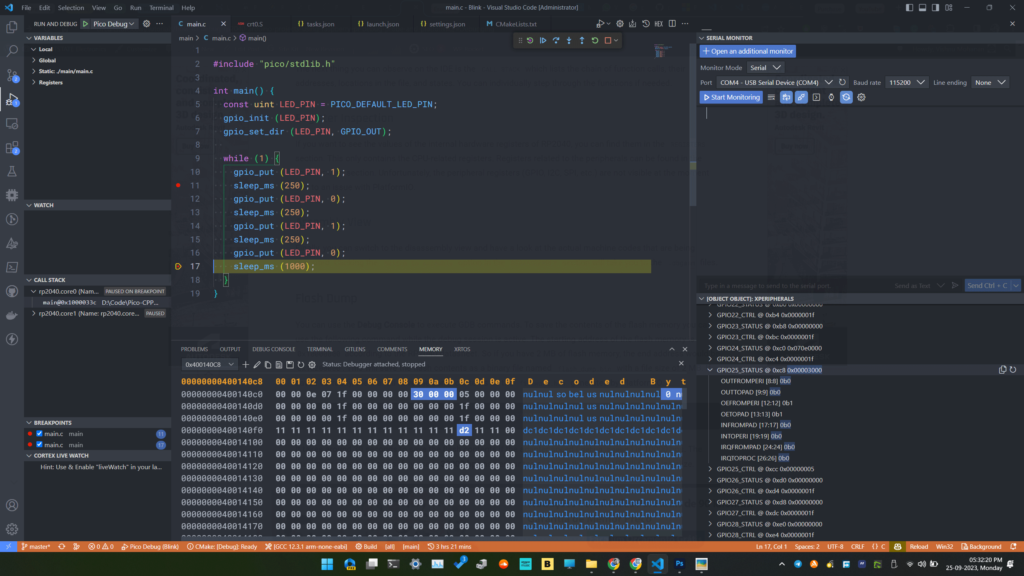
You can inspect the memory contents in real time using the Memory View extension for VS Code. After installing, you will get a new MEMORY tab in the panel. When the debugging is in the paused state, click on the + button and enter an address or C-like expression to get the memory contents. For example, when we blink the LED connected to GPIO25, some registers related to that GPIO will change when we break each line of code. GPIO25 status register has the address 0x400140C8. So we can enter that to start the memory view. When the contents of the memory changes, it will be highlighted in the memory panel.
Troubleshooting
We hope this tutorial was helpful to you. If you have suggestions for improving this tutorial, please let us know in the comments. Happy debugging 🐞
Links
- Raspberry Pi Debug Probe – Product Page
- Raspberry Pi Debug Probe product brief [PDF]
- Raspberry Pi Debug Probe – Official Documentation
- Getting Started with Raspberry Pi Pico : RP2040 Microcontroller Board – Pinout, Schematic and Programming Tutorial
- How to Use VS Code for Creating and Uploading Arduino Sketches
- Raspberry Pi Pico RP2040 Microcontroller Board – Pinout Diagram & Arduino Pin Reference
- JTAG – Wikipedia
- CMSIS-DAP – Official Documentation
- SWD – Documentation
- CoreSight Debug and Trace Unit – ARM Developer Documentation
- CMSIS 5 – GitHub
- OpenOCD – Homepage
- Picoprobe – GitHub
- JST SM03B-SRSS-TB – DigiKey
- Raspberry Pi 3-pin Debug Connector Specification [PDF]
- Visual Studio Code for C/C++ with ARM Cortex-M: Part 4 – Debug – Erich Styger
- Zadig – USB Driver Tool
Short Link
- Short URL to this page – https://www.circuitstate.com/picodebugprobevsc
