Debugging ESP32 Arduino & ESP-IDF Projects using ESP-Prog and PlatformIO

In our last post, we learned almost everything you wanted to know about the Espressif ESP32 Wi-Fi and Bluetooth SoC, except debugging. If you come from an Arduino background, debugging must feel like an untackled mountain that you have seen from afar and didn’t quite get closer. You must have already used trace code debugging to fix issues with your code. The original Arduino IDE was not designed with full-fledged hardware debugging in mind. It had to be simple and intuitive enough for a beginner. So debugging was put off for later. The latest Arduino IDE 2 brings native debugging capabilities to the platform and you can use it with supported boards. In this post, we will show you how you can debug your ESP32 Arduino projects as well as ESP-IDF projects using the official ESP-Prog debugger/programmer tool. We will use the familiar DOIT ESP32 DevKit V1 board as the target board. We won’t be using the Arduino IDE, and instead use PlatformIO with VS Code.
What is Debugging?
A bug is an issue in a program and debugging is the process of finding and fixing them. There are many methods for debugging and they vary based on the system type and capabilities. In this tutorial, we will be specifically looking at embedded hardware debugging using dedicated debugging tools, both software and hardware. We will need a debug probe for accessing the debug capabilities of the embedded hardware. A debug probe (sometimes called debugger or programmer) is a device that can be connected to a target processor on one end and the other end to a computer. A debug probe can, in most cases, upload firmware to the target system. All embedded processor manufacturers produce special debug probes for their own products. These are usually expensive. Fortunately, you can get the ESP-Prog debug probe we are going to use in this tutorial is available for around INR 1600.
ESP32 JTAG

JTAG stands for Joint Test Action Group and is generally used as a synonym for the IEEE 1149.1 standard initially designed for testing and verification of IC designs. Today, JTAG is also used for embedded hardware debugging and most of the modern microcontrollers support it. ESP32 also has a JTAG peripheral inside the chip. This peripheral can communicate with the CPU and memory of the microcontroller. This is achieved with the help of a Test Access Port (TAP) controller which has a set of registers and supports a set of instructions. The TAP exposes a set of pins to access the functionalities. These pins are usually,
| Pin Name | JTAG Pin Description |
|---|---|
| TMS | Test Mode Select |
| TCK | Test Clock Input |
| TDI | Test Data Input |
| TDO | Test Data Output |
| TRST | Test Reset (optional) |
JTAG is a synchronous serial communication standard. You can think of the JTAG as a shift register with many registers and states. The state of the TAP controller can be controlled with the help of the TMS signal. The TCK is the common clock source (JTAG can be chained if needed) generated by a JTAG adapter or host. TDI is the test data input and TDO is the test data output. TRST is an optional pin to reset the entire system. It is optional because a system reset can also be initiated by a software instruction.
Another important term associated with JTAG is the Boundary Scanning technique. This is a core concept of JTAG testing. But for debugging microcontroller software, we don’t need the boundary scanning functionality. Instead, the JTAG peripheral inside a microcontroller will allow us to read and write all internal registers and memory locations, halt/resume the CPU, and single-step through instructions. This will help us inspect the microcontroller system in real time while the system is running.
To do JTAG debugging, we need to connect a Device Under Test (DUT), typically a microcontroller system, to a host computer. Since we can not connect the JTAG pins directly to a computer, we need a JTAG adapter that can convert the JTAG signals to a different protocol such as USB. Another interface similar to JTAG is SWD (Serial Wire Debug) which only requires two pins for debugging. Unfortunately, ESP32 doesn’t support SWD.
In ESP32 the JTAG functionality is shared between a few fixed GPIO pins. For ESP32 the GPIO pins are shown in the table below.
| Pin Name | GPIO | Function |
|---|---|---|
| MTDI | 12 | Test Data In |
| MTCK | 13 | Test Clock |
| MTMS | 14 | Test Mode Select |
| MTDO | 15 | Test Data Out |
If you need a pin reference for ESP32 and the DOIT ESP32 DevKit V1 board, we have a detailed pinout diagram on CIRCUITSTATE.
DOIT ESP32 DevKit V1 Wi-Fi Development Board – Pinout Diagram & Arduino Reference
ESP-Prog
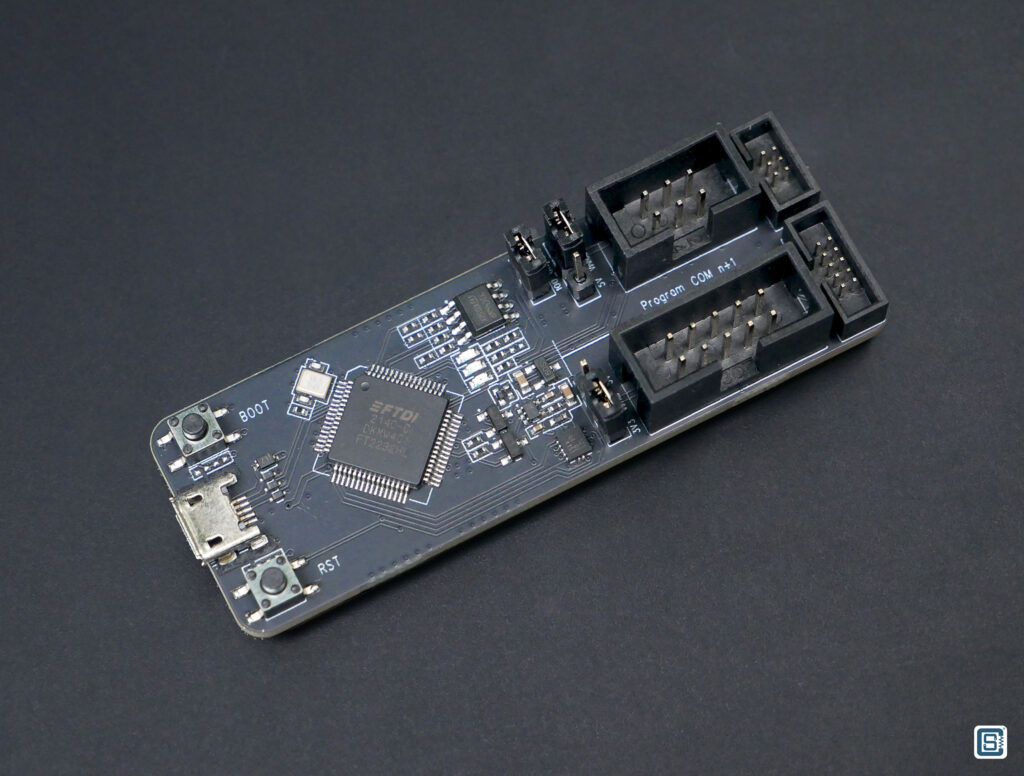
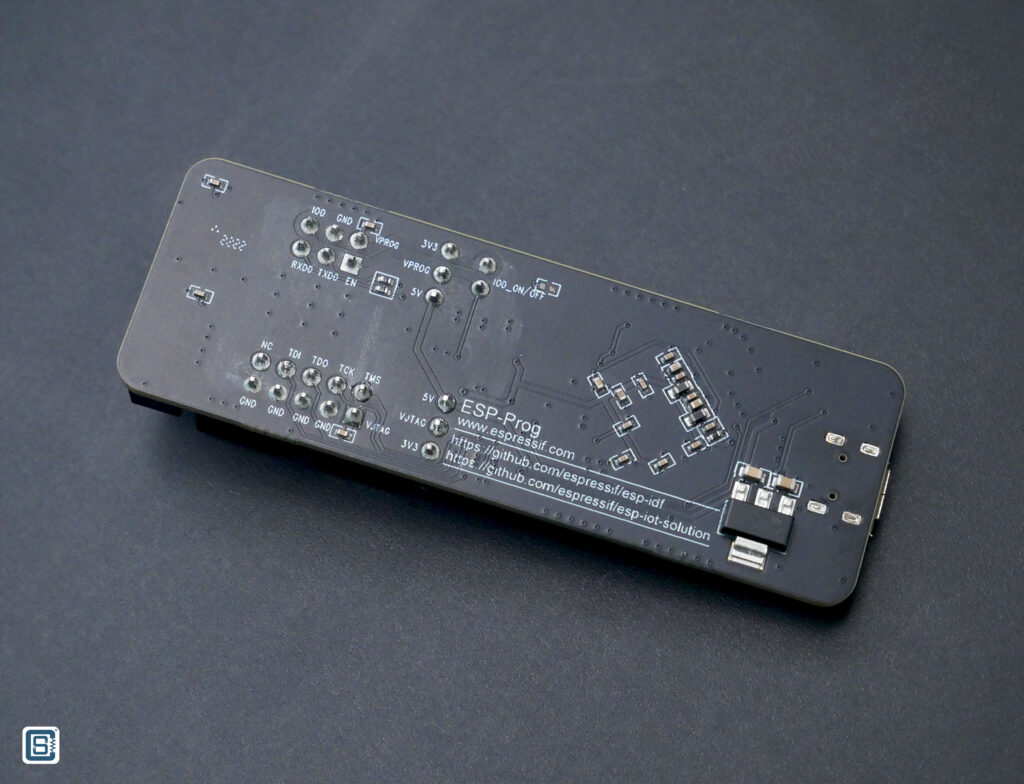
ESP-Prog is the official programming and debug adapter for the ESP32 family of SoCs. It is based on the FT2232HL chip which is a USB to dual-channel UART/FIFO/JTAG/SPI/I2C converter from FTDI. The functionality of FTDI2232HL is controlled by a device driver running on the host system. Shown below is the block diagram of the ESP-Prog.
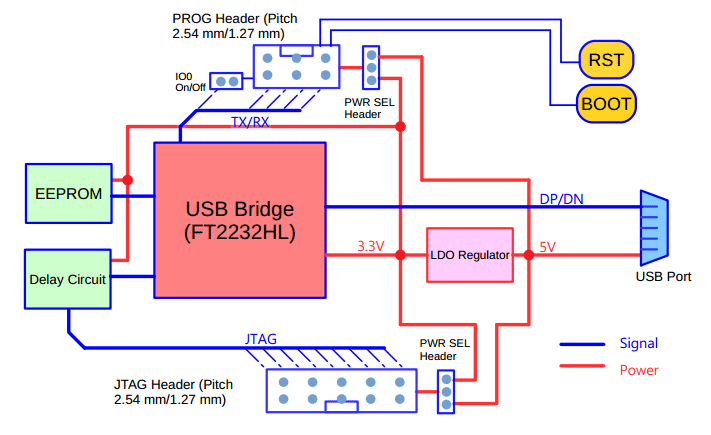
ESP-Prog supports the following functions.
- Reset and Boot buttons for the target SoC.
- Serial auto-programming via a UART port.
- JTAG programming and debugging.
The two push buttons RST and BOOT are connected to the target ESP32’s EN and GPIO0 pins respectively. So even if your target board does not have them, you can control them directly with the ESP-Prog. If you only want to program your target, then you can use the UART serial programming interface which supports auto-programming. For JTAG debugging, you need to connect the ESP32’s dedicated JTAG pins to the JTAG header on the ESP-Prog.
ESP-Prog has both 2.54 mm and 1.27 mm headers (IDC sockets) with identical pinouts for connecting to your board. The package comes with 6-pin and 10-pin 1.27 mm ribbon cables. Unlike other JTAG debug probes from other vendors such as STM, which only work with their own microcontrollers, ESP-Prog is a generic JTAG probe. ESP-Prog design is open-source and you can download the design files from the Espressif documentation website.
If you are new to ESP32, we have a great tutorial to get you started. You can use the popular DOIT ESP32 DevKit V1 board for the tutorial.
Getting Started with Espressif ESP32 Wi-Fi & Bluetooth SoC using DOIT-ESP32-DevKit-V1 Development Board
Pinout
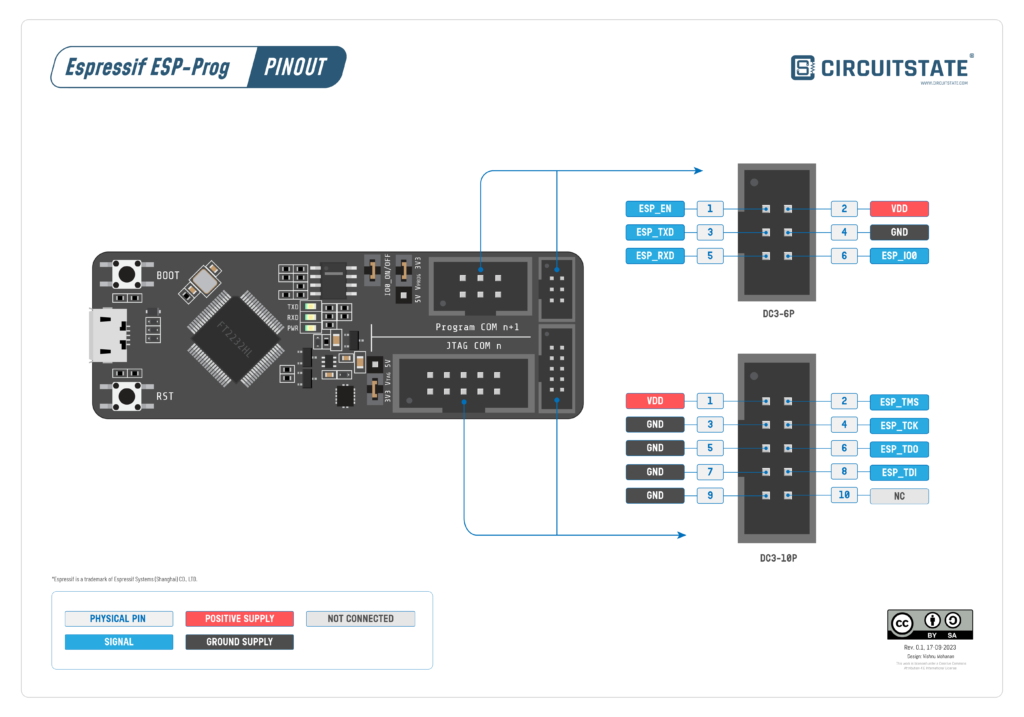
ESP-Prog supports both 5V and 3.3V supplies for the target. Two 3-pin jumpers are provided to select the target voltage. ESP32 SoCs require 3.3V and therefore you must not put the jumpers to 5V mode. You can also disconnect ESP-Prog from the GPIO0 (Boot pin) using the IO0_ON/OFF jumper.
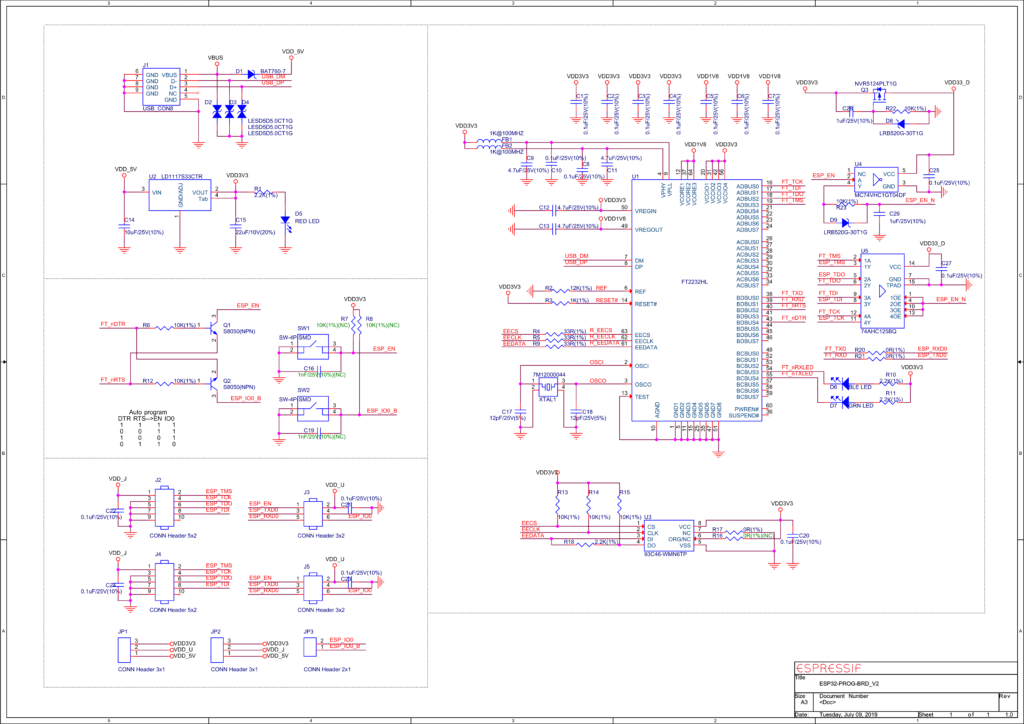
Schematic
Installing Drivers
The latest drivers for the FT2232HL can be downloaded from the FTDI website. You can download the suitable driver for your system and install it. For this tutorial, we are using a 64-bit Windows 11 system. When you connect the ESP-Prog to your system, two COM ports are created. One of them will be used as a UART port (Interface 1) and the other as a JTAG port (Interface 0). In our case, the COM port numbers are COM30 (JTAG) and COM31 (UART).
But there is a problem. OpenOCD on Windows can not use the FTDI drivers to talk to the JTAG port of ESP-Prog. To fix that issue, we must replace the FTDI driver of Interface 0 of the FT2232HL (VID 0403, PID 6010) with the WinUSB driver. This can be done with a tool called Zadig. After running Zadig, you need to go to Options -> List all devices to make all devices visible.
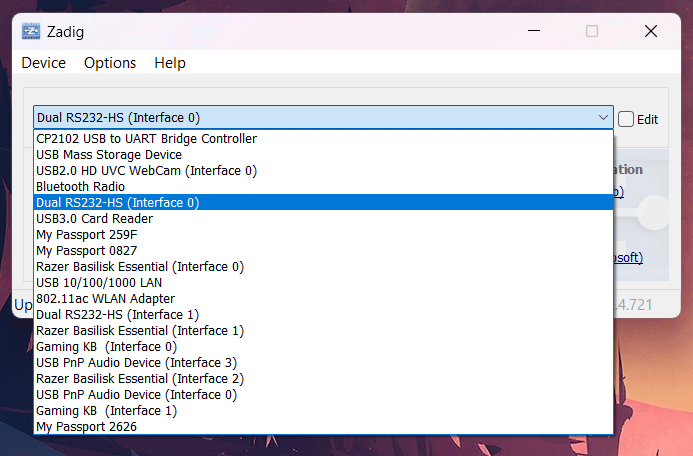
Then you need to select the Dual RS232-HS (Interface 0) item from the list. This is the JTAG interface associated with ESP-Prog. The current driver will be FTDIBUS as you can see from the screenshot below.
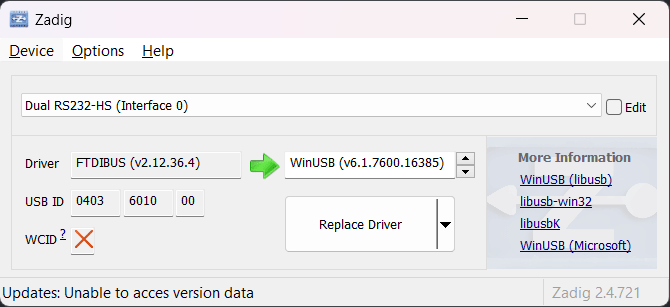
We need to replace that with a WinUSB driver by clicking the Replace Driver button. It can take a few seconds for the driver to install. Wait until it finishes. If the operation is successful, the FTDIBUS driver for Interface 0 will be replaced with WinUSB. You can close Zadig now.
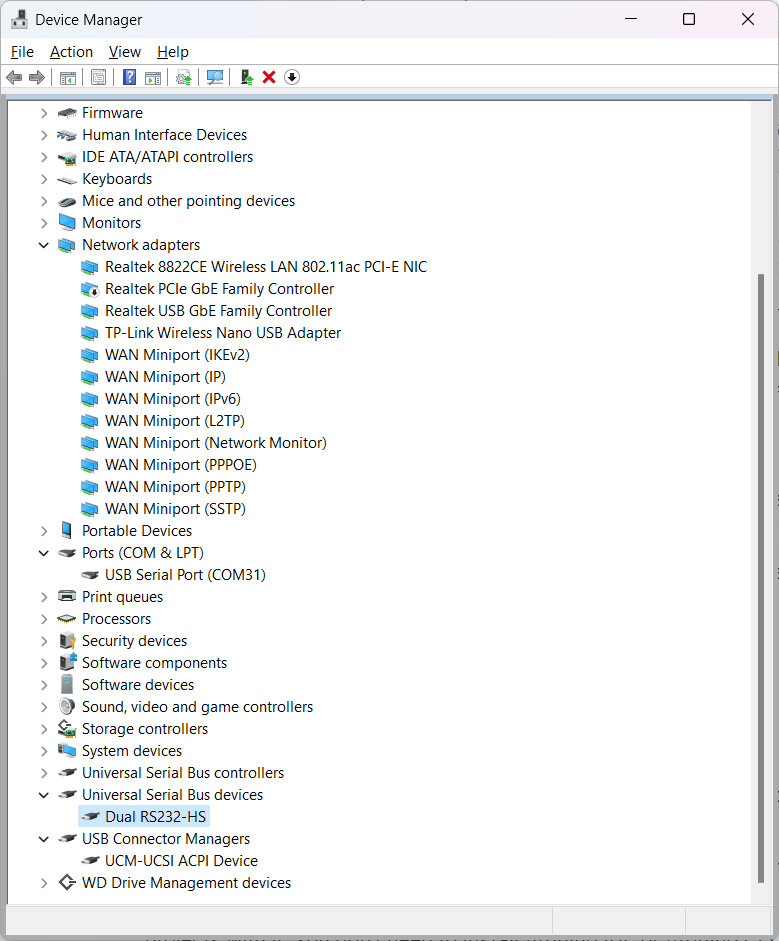
Now if you go to the Windows Device Manager, you will see that one of the COM ports associated with ESP-Prog has now disappeared. This is because we replaced the COM port driver with a different one. So now there is only one COM port (Interface 1) associated with ESP-Prog which you can use for serial programming ESP32 boards.
The Interface 0 should now appear as Dual RS232-HS under the Universal Serial Bus devices category. From now on, OpenOCD will be able to detect your ESP-Prog’s JTAG port correctly and communicate with it. You do not need to do anything specific in PIO for this to work, apart from setting debug_protocol to esp-prog.
PlatformIO
PlatformIO is an open-source unified framework for developing embedded software. It unifies a large number of SDKs, toolchains, frameworks, protocols, processor architectures, programmers, and debuggers into a single platform. PIO makes it extremely easy to develop and debug your embedded projects, without resorting to vendor-specific tools. PIO can be installed as an extension to VS Code and you can create Arduino or ESP-IDF projects with it. You don’t need to install Arduino IDE or Arduino CLI for the PIO extension to work. PIO can install and configure everything for you as long as you have an internet connection. We highly suggest you check out PIO because once you use it, you won’t go back to other tools. We will be using PIO and VS Code for debugging ESP32 software.
OpenOCD
OpenOCD stands for Open On-Chip Debugger and it is a software that was originally created by Dominic Rath that can communicate with the JTAG interface in your microcontroller. OpenOCD is an open-source software and it supports a large variety of debuggers and programmers from different vendors. As you may have assumed, OpenOCD also supports the FT2232HL chip and we can use the JTAG functionality through one of the ports.
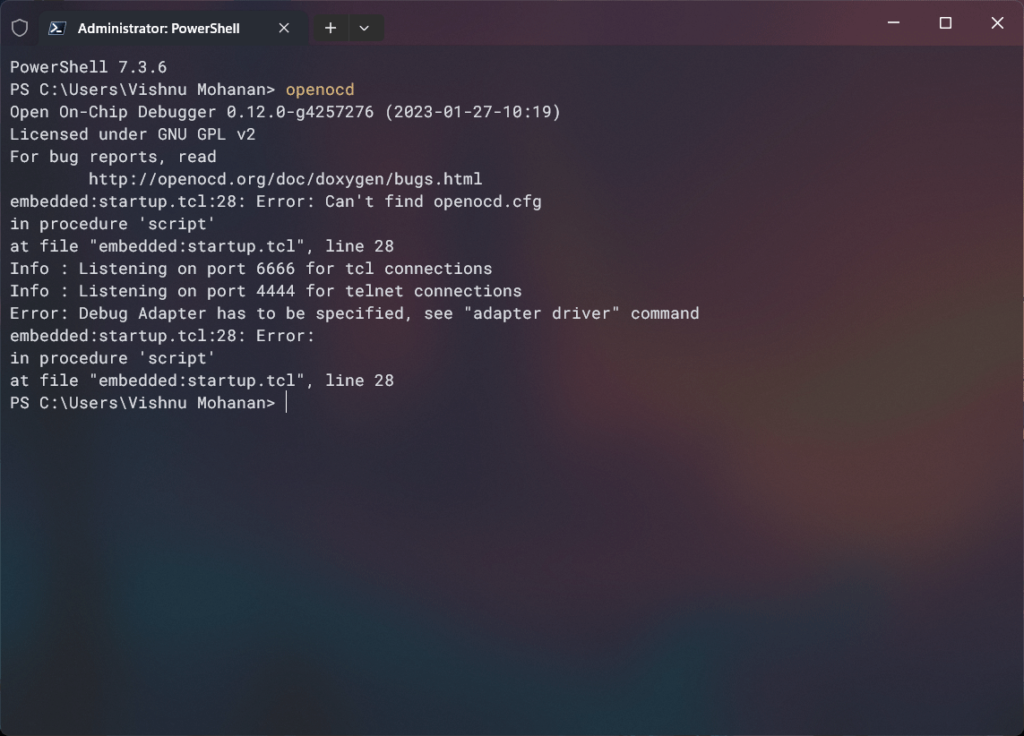
OpenOCD is a command-line tool and can be invoked from Windows Terminal if installed correctly. You can manually install OpenOCD and add it to the PATH or if you are installing the ESP-IDF framework, OpenOCD will be installed automatically. To check if your system has OpenOCD, you can open the terminal and run the command “openocd”. This will print the version information of OpenOCD if it is present. Otherwise, you will get an unknown command error from the terminal.
OpenOCD is not a standalone debugger. Its main function is to mediate the communication between a debugger and many types of debug adapters and targets. For the actual debugging to happen, a debugger software should interpret the data output by OpenOCD and give the user the necessary controls for debugging the code. We will use GDB as the debugger for this tutorial. Even though OpenOCD and GDB are essential components for the debugging demo presented in this tutorial, we won’t cover them in detail. We will post dedicated tutorials on both of them in the future.
GDB
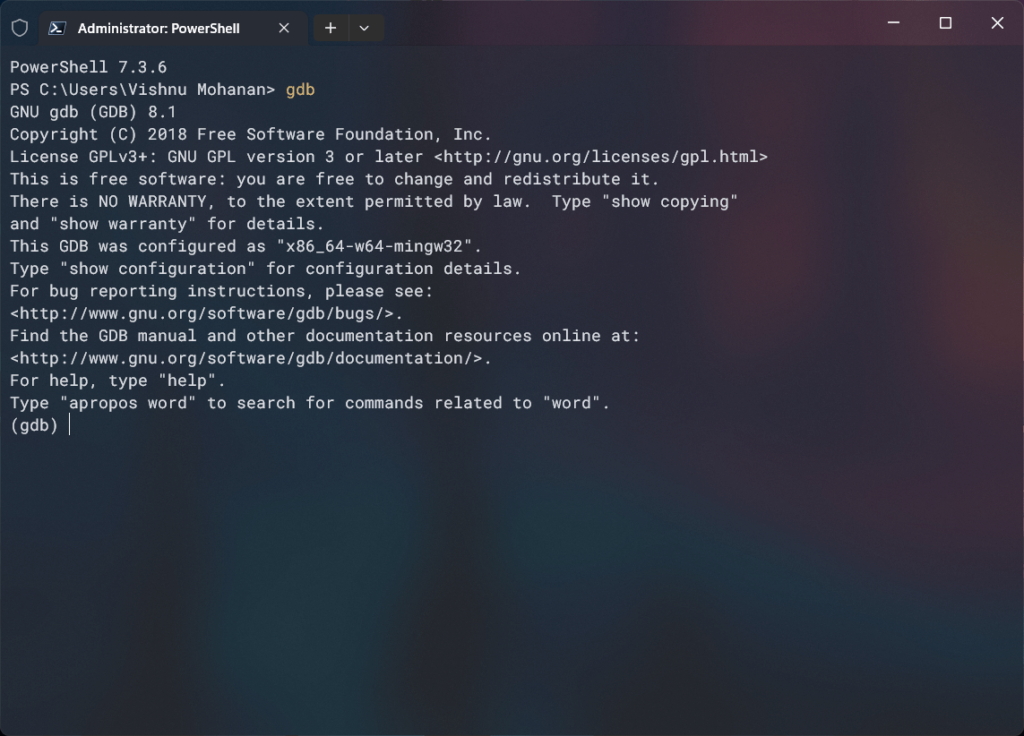
GDB (GNU Debugger) is an open-source debugger software developed by Richard Stallman that is part of the GNU software system. It acts as the front-end for debugging both application software as well as embedded software. GNU can offer native debugging of software targeted for the same hardware GDB is running on, or it can do remote debugging with the actual software running elsewhere. This is how we will incorporate both OpenOCD and GDB in our debugging. OpenOCD can open a GDB server that can accept commands, execute them in the target hardware with the help of a debug adapter, and return the results back to the GDB. To accomplish this GDB must act as a client for remote debugging and communicate with the GDB server opened by OpenOCD.
Debugging
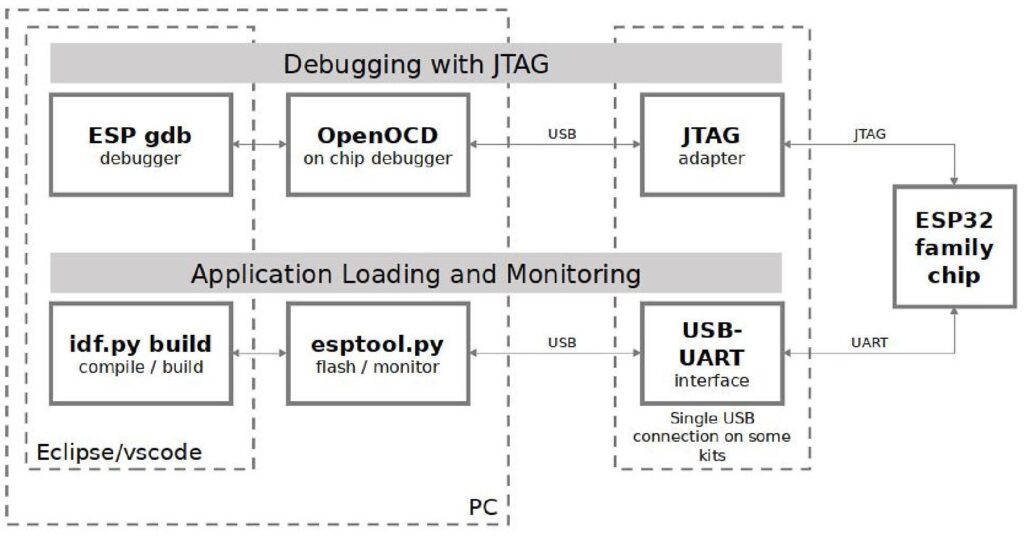
We can finally start the debugging. We assume that you have all the necessary tools installed on your system before we begin. You need VS Code, PlatformIO extension, OpenOCD, GDB, and ESP-Prog set up correctly. OpenOCD and GDB will be set up by PIO automatically.
We will create two simple projects, one using the Arduino framework and another one using the ESP-IDF framework. Before proceeding, you must connect the JTAG pins of the ESP32 board to the ESP-Prog JTAG header. If you are powering the ESP-Prog and the ESP32 board with separate USB cables, then you do not need to connect the VCC pin of the ESP-Prog to the ESP32. Just connecting the GND pins together is enough.
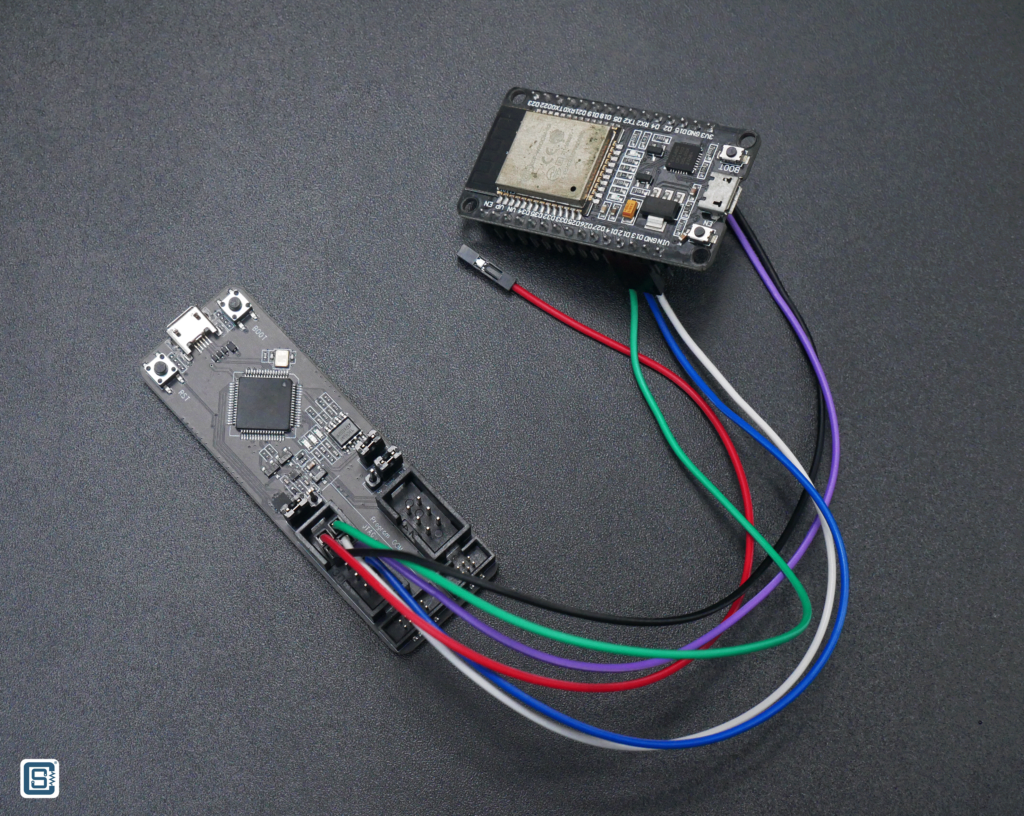
Arduino Framework
We have to first create an Arduino project using the Arduino framework. We will use the following code in the main.cpp file. It is a basic LED blink sketch with two additional variables.
#include <Arduino.h>

uint8_t globalCounter = 0;

void setup() {
  // put your setup code here, to run once:
  Serial.begin (115200);
  Serial.println ("Blink with ESP32");
  pinMode (LED_BUILTIN, OUTPUT);
}

void loop() {
  // put your main code here, to run repeatedly:
  static uint8_t localCounter = 0;

  digitalWrite (LED_BUILTIN, HIGH);
  delay (100);
  digitalWrite (LED_BUILTIN, LOW);
  delay (100);

  localCounter += 2;
  globalCounter++;
}Our PIO configuration file looks like the following.
[env:esp32doit-devkit-v1]
platform = espressif32
board = esp32doit-devkit-v1
framework = arduino
upload_protocol = esp-prog
debug_tool = esp-progWe are using ESP-Prog for both uploading the firmware and debugging. So you can set both the upload_protocol and debug_tool to esp-prog. You can also use the ESP serial port for normal programming which is the default one. You can set the upload_protocol to esptool or comment out that line entirely to use the default protocol.
Uploading
After setting up the configuration file, you can check if everything is working correctly by flashing the firmware using the PlatformIO: Upload button on the bottom. Below is the build log from VS Code.
 *  Executing task: C:\.PIO\penv\Scripts\platformio.exe run --target upload

Processing esp32doit-devkit-v1 (platform: espressif32; board: esp32doit-devkit-v1; framework: arduino)
------------------------------------------------------------------------------------------------------------------
Verbose mode can be enabled via `-v, --verbose` option
CONFIGURATION: https://docs.platformio.org/page/boards/espressif32/esp32doit-devkit-v1.html
PLATFORM: Espressif 32 (6.4.0+sha.4af2332) > DOIT ESP32 DEVKIT V1
HARDWARE: ESP32 240MHz, 320KB RAM, 4MB Flash
DEBUG: Current (esp-prog) External (cmsis-dap, esp-bridge, esp-prog, iot-bus-jtag, jlink, minimodule, olimex-arm-usb-ocd, olimex-arm-usb-ocd-h, olimex-arm-usb-tiny-h, olimex-jtag-tiny, tumpa)
PACKAGES:
 - framework-arduinoespressif32 @ 3.20011.230801 (2.0.11)
 - tool-esptoolpy @ 1.40501.0 (4.5.1)
 - tool-mkfatfs @ 2.0.1
 - tool-mklittlefs @ 1.203.210628 (2.3)
 - tool-mkspiffs @ 2.230.0 (2.30)
 - tool-openocd-esp32 @ 2.1100.20220706 (11.0)
 - toolchain-xtensa-esp32 @ 8.4.0+2021r2-patch5
LDF: Library Dependency Finder -> https://bit.ly/configure-pio-ldf
LDF Modes: Finder ~ chain, Compatibility ~ soft
Found 33 compatible libraries
Scanning dependencies...
No dependencies
Building in release mode
Compiling .pio\build\esp32doit-devkit-v1\src\main.cpp.o
Building .pio\build\esp32doit-devkit-v1\bootloader.bin
Generating partitions .pio\build\esp32doit-devkit-v1\partitions.bin
esptool.py v4.5.1
Creating esp32 image...
Merged 1 ELF section
Successfully created esp32 image.
Compiling .pio\build\esp32doit-devkit-v1\FrameworkArduino\Esp.cpp.o
Compiling .pio\build\esp32doit-devkit-v1\FrameworkArduino\FirmwareMSC.cpp.o
Compiling .pio\build\esp32doit-devkit-v1\FrameworkArduino\FunctionalInterrupt.cpp.o
Compiling .pio\build\esp32doit-devkit-v1\FrameworkArduino\HWCDC.cpp.o
Compiling .pio\build\esp32doit-devkit-v1\FrameworkArduino\HardwareSerial.cpp.o
Compiling .pio\build\esp32doit-devkit-v1\FrameworkArduino\IPAddress.cpp.o
Compiling .pio\build\esp32doit-devkit-v1\FrameworkArduino\IPv6Address.cpp.o
Compiling .pio\build\esp32doit-devkit-v1\FrameworkArduino\MD5Builder.cpp.o
Compiling .pio\build\esp32doit-devkit-v1\FrameworkArduino\Print.cpp.o
Compiling .pio\build\esp32doit-devkit-v1\FrameworkArduino\Stream.cpp.o
Compiling .pio\build\esp32doit-devkit-v1\FrameworkArduino\StreamString.cpp.o
Compiling .pio\build\esp32doit-devkit-v1\FrameworkArduino\Tone.cpp.o
Compiling .pio\build\esp32doit-devkit-v1\FrameworkArduino\USB.cpp.o
Compiling .pio\build\esp32doit-devkit-v1\FrameworkArduino\USBCDC.cpp.o
Compiling .pio\build\esp32doit-devkit-v1\FrameworkArduino\USBMSC.cpp.o
Compiling .pio\build\esp32doit-devkit-v1\FrameworkArduino\WMath.cpp.o
Compiling .pio\build\esp32doit-devkit-v1\FrameworkArduino\WString.cpp.o
Compiling .pio\build\esp32doit-devkit-v1\FrameworkArduino\base64.cpp.o
Compiling .pio\build\esp32doit-devkit-v1\FrameworkArduino\cbuf.cpp.o
Compiling .pio\build\esp32doit-devkit-v1\FrameworkArduino\esp32-hal-adc.c.o
Compiling .pio\build\esp32doit-devkit-v1\FrameworkArduino\esp32-hal-bt.c.o
Compiling .pio\build\esp32doit-devkit-v1\FrameworkArduino\esp32-hal-cpu.c.o
Compiling .pio\build\esp32doit-devkit-v1\FrameworkArduino\esp32-hal-dac.c.o
Compiling .pio\build\esp32doit-devkit-v1\FrameworkArduino\esp32-hal-gpio.c.o
Compiling .pio\build\esp32doit-devkit-v1\FrameworkArduino\esp32-hal-i2c-slave.c.o
Compiling .pio\build\esp32doit-devkit-v1\FrameworkArduino\esp32-hal-i2c.c.o
Compiling .pio\build\esp32doit-devkit-v1\FrameworkArduino\esp32-hal-ledc.c.o
Compiling .pio\build\esp32doit-devkit-v1\FrameworkArduino\esp32-hal-matrix.c.o
Compiling .pio\build\esp32doit-devkit-v1\FrameworkArduino\esp32-hal-misc.c.o
Compiling .pio\build\esp32doit-devkit-v1\FrameworkArduino\esp32-hal-psram.c.o
Compiling .pio\build\esp32doit-devkit-v1\FrameworkArduino\esp32-hal-rgb-led.c.o
Compiling .pio\build\esp32doit-devkit-v1\FrameworkArduino\esp32-hal-rmt.c.o
Compiling .pio\build\esp32doit-devkit-v1\FrameworkArduino\esp32-hal-sigmadelta.c.o
Compiling .pio\build\esp32doit-devkit-v1\FrameworkArduino\esp32-hal-spi.c.o
Compiling .pio\build\esp32doit-devkit-v1\FrameworkArduino\esp32-hal-time.c.o
Compiling .pio\build\esp32doit-devkit-v1\FrameworkArduino\esp32-hal-timer.c.o
Compiling .pio\build\esp32doit-devkit-v1\FrameworkArduino\esp32-hal-tinyusb.c.o
Compiling .pio\build\esp32doit-devkit-v1\FrameworkArduino\esp32-hal-touch.c.o
Compiling .pio\build\esp32doit-devkit-v1\FrameworkArduino\esp32-hal-uart.c.o
Compiling .pio\build\esp32doit-devkit-v1\FrameworkArduino\firmware_msc_fat.c.o
Compiling .pio\build\esp32doit-devkit-v1\FrameworkArduino\libb64\cdecode.c.o
Compiling .pio\build\esp32doit-devkit-v1\FrameworkArduino\libb64\cencode.c.o
Compiling .pio\build\esp32doit-devkit-v1\FrameworkArduino\main.cpp.o
Compiling .pio\build\esp32doit-devkit-v1\FrameworkArduino\stdlib_noniso.c.o
Compiling .pio\build\esp32doit-devkit-v1\FrameworkArduino\wiring_pulse.c.o
Compiling .pio\build\esp32doit-devkit-v1\FrameworkArduino\wiring_shift.c.o
Archiving .pio\build\esp32doit-devkit-v1\libFrameworkArduino.a
Indexing .pio\build\esp32doit-devkit-v1\libFrameworkArduino.a
Linking .pio\build\esp32doit-devkit-v1\firmware.elf
Retrieving maximum program size .pio\build\esp32doit-devkit-v1\firmware.elf
Checking size .pio\build\esp32doit-devkit-v1\firmware.elf
Advanced Memory Usage is available via "PlatformIO Home > Project Inspect"
RAM:   [=         ]   6.5% (used 21416 bytes from 327680 bytes)
Flash: [==        ]  20.2% (used 265045 bytes from 1310720 bytes)
Building .pio\build\esp32doit-devkit-v1\firmware.bin
esptool.py v4.5.1
Creating esp32 image...
Merged 2 ELF sections
Successfully created esp32 image.
Configuring upload protocol...
AVAILABLE: cmsis-dap, esp-bridge, esp-prog, espota, esptool, iot-bus-jtag, jlink, minimodule, olimex-arm-usb-ocd, olimex-arm-usb-ocd-h, olimex-arm-usb-tiny-h, olimex-jtag-tiny, tumpa
CURRENT: upload_protocol = esp-prog
Uploading .pio\build\esp32doit-devkit-v1\firmware.bin
Open On-Chip Debugger  v0.11.0-esp32-20220706 (2022-07-06-15:48)
Licensed under GNU GPL v2
For bug reports, read
        http://openocd.org/doc/doxygen/bugs.html
debug_level: 1

adapter speed: 20000 kHz

WARNING: boards/esp-wroom-32.cfg is deprecated, and may be removed in a future release.
adapter speed: 5000 kHz

Error: libusb_open() failed with LIBUSB_ERROR_NOT_SUPPORTED
** Programming Started **
** Programming Finished in 4489 ms **
** Verify Started **
** Verify OK **
** Programming Started **
** Programming Finished in 1178 ms **
** Verify Started **
** Verify OK **
** Programming Started **
** Programming Finished in 839 ms **
** Verify Started **
** Verify OK **
** Programming Started **
** Programming Finished in 915 ms **
** Verify Started **
** Verify OK **
shutdown command invoked
========================================== [SUCCESS] Took 22.09 seconds ==========================================
* Terminal will be reused by tasks, press any key to close it. As you can see from the log, there are many choices for uploading and debugging ESP32.
- Upload Protocols
cmsis-dapesp-bridgeesp-progespotaesptooliot-bus-jtagjlinkminimoduleolimex-arm-usb-ocdolimex-arm-usb-ocd-holimex-arm-usb-tiny-holimex-jtag-tinytumpa
- Debug Protocols
cmsis-dapesp-bridgeesp-progiot-bus-jtagjlinkminimoduleolimex-arm-usb-ocdolimex-arm-usb-ocd-holimex-arm-usb-tiny-holimex-jtag-tinytumpa
Start Debugging
If uploading is successful, we can go to the Run and Debug tab on the left or start debugging from Run → Start Debugging. Once debugging starts, you will get a window like shown below.
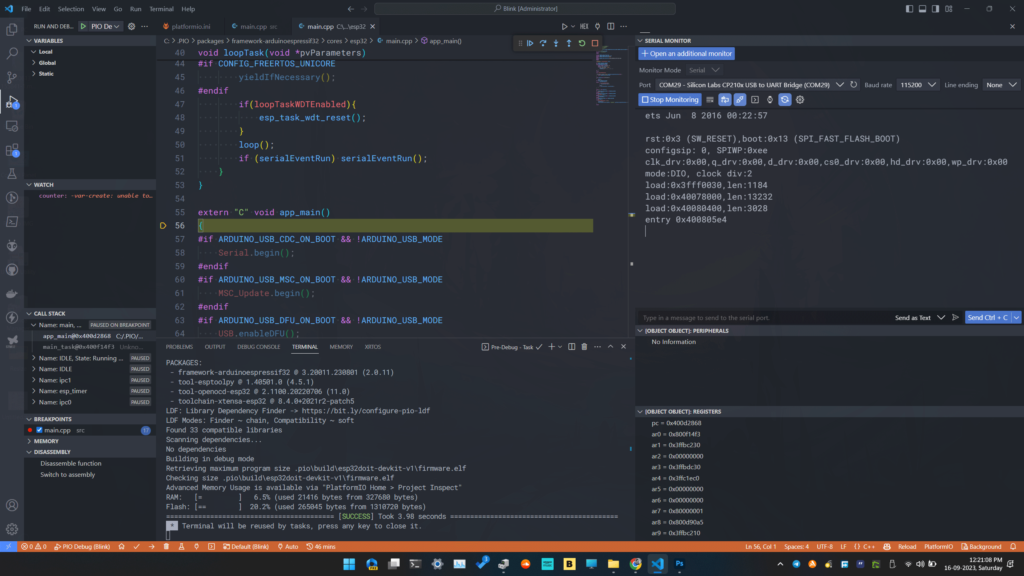
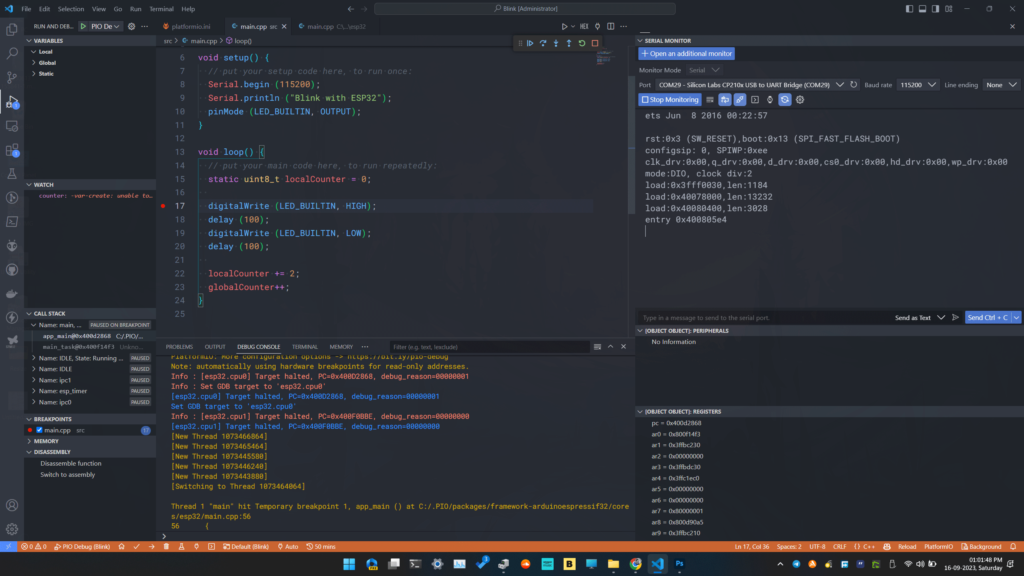
The status bar (on the bottom) of VS Code turns orange indicating that debugging is active. The sidebar will show multiple tabs like VARIABLES, WATCH, etc. On the right, we have the serial monitor open which connects to the UART of the DOIT ESP32 DevKit V1 board. We can keep it always on since we are not using it for programming. So will be able to see everything printed by the ESP32 without interruptions. You will also notice the floating debug toolbar with 6 icons on it. We will explain all of their functions in a moment. First, let us explain what is happening.
Breakpoint
After the debugging starts, the CPU of ESP32 will be halted by the debugger. This is so that the user will be able to resume the code execution on their own. Where the code is halted is called a breakpoint. A breakpoint is simply the location of an instruction (address of the instruction) in your main code where the debugger will halt/pause the CPU. Breakpoints can be hardware or software types. Hardware breakpoints are faster but limited in number. Software breakpoints are directly placed in our code as a breakpoint instruction or flag. VS Code will move the cursor to the line of code where the current breakpoint is situated. If the file is not open, VS Code will automatically open it for you. In the previous screenshot, the breakpoint was located in the main.cpp template file of the Arduino-ESP32 core. From the previous tutorials, we know that the Arduino framework requires a main.cpp file and the entry point of the file will be a function called app_main() for ESP32 SoCs. The debugger paused the code just at the entry point of the app_main() function. So our actual code has not yet started executing.
Debug Console
To understand what the debugger is doing, we can take a look at the DEBUG CONSOLE tab in the panel of VS Code. Inputs to the debug console will be sent to GDB.
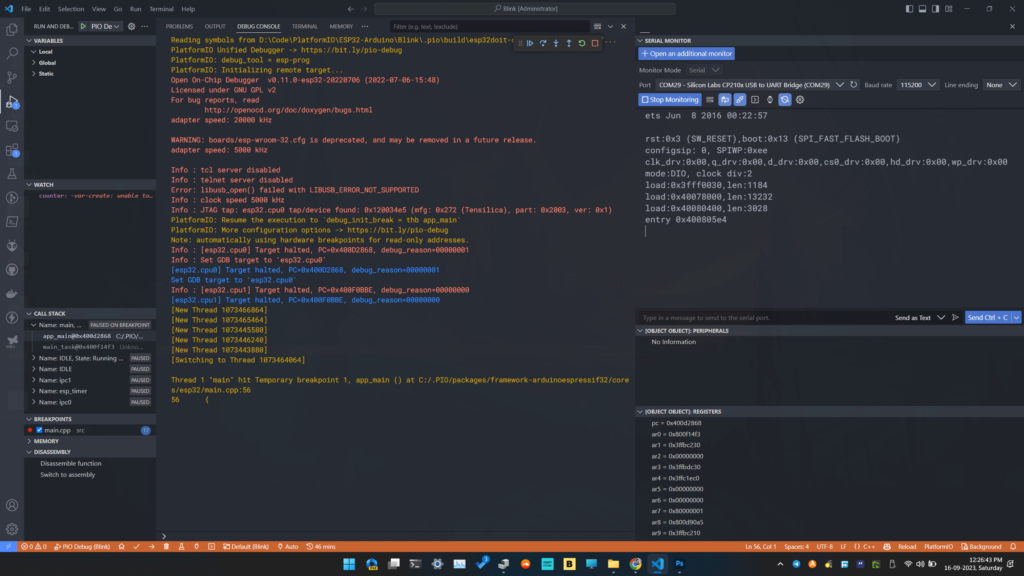
Reading symbols from D:\Code\PlatformIO\ESP32-Arduino\Blink\.pio\build\esp32doit-devkit-v1\firmware.elf...
PlatformIO Unified Debugger -> https://bit.ly/pio-debug
PlatformIO: debug_tool = esp-prog
PlatformIO: Initializing remote target...
Open On-Chip Debugger  v0.11.0-esp32-20220706 (2022-07-06-15:48)
Licensed under GNU GPL v2
For bug reports, read
	http://openocd.org/doc/doxygen/bugs.html
adapter speed: 20000 kHz

WARNING: boards/esp-wroom-32.cfg is deprecated, and may be removed in a future release.
adapter speed: 5000 kHz

Info : tcl server disabled
Info : telnet server disabled
Error: libusb_open() failed with LIBUSB_ERROR_NOT_SUPPORTED
Info : clock speed 5000 kHz
Info : JTAG tap: esp32.cpu0 tap/device found: 0x120034e5 (mfg: 0x272 (Tensilica), part: 0x2003, ver: 0x1)
PlatformIO: Resume the execution to `debug_init_break = thb app_main`
PlatformIO: More configuration options -> https://bit.ly/pio-debug
Note: automatically using hardware breakpoints for read-only addresses.
Info : [esp32.cpu0] Target halted, PC=0x400D2868, debug_reason=00000001
Info : Set GDB target to 'esp32.cpu0'
[esp32.cpu0] Target halted, PC=0x400D2868, debug_reason=00000001
Set GDB target to 'esp32.cpu0'
Info : [esp32.cpu1] Target halted, PC=0x400F0BBE, debug_reason=00000000
[esp32.cpu1] Target halted, PC=0x400F0BBE, debug_reason=00000000
[New Thread 1073466864]
[New Thread 1073465464]
[New Thread 1073445580]
[New Thread 1073446240]
[New Thread 1073443880]
[Switching to Thread 1073464064]

Thread 1 "main" hit Temporary breakpoint 1, app_main () at C:/.PIO/packages/framework-arduinoespressif32/cores/esp32/main.cpp:56
56 {A lot of things are happening there starting with the initialization of OpenOCD. OpenOCD requires a configuration file for communicating with the target. In this case, the target is the ESP32 SoC. The configuration file used for this is called esp-wroom-32.cfg. After that, the JTAG adapter speed is set to 5000 KHz which is the default. If you want to set a custom speed, you can add that to the PIO configuration file using the debug_speed option.
OpenOCD also supports TCL and Telnet for debug servers but since we are not using them, they are disabled. The next interesting line is where the OpenOCD finds a compatible JTAG interface. This is printed as an info line.
Info : JTAG tap: esp32.cpu0 tap/device found: 0x120034e5 (mfg: 0x272 (Tensilica), part: 0x2003, ver: 0x1)An active TAP controller was found through the ESP-Prog debug probe. If the ESP32 board is not correctly connected, this step will fail. Next, the PIO pauses the execution at the start of the app_main() function automatically. Since ESP32 has two CPU cores, both of them will be halted but at different addresses. This is because both CPU cores are expected to run different programs parallelly.
Adding Breakpoint
In order to pause execution on our main code, we have put a breakpoint at line 17 of the code. You can set breakpoints in VS Code by clicking on the breakpoint button corresponding to a line. Here, the breakpoint is indicated by a red dot next to the line. You can add multiple breakpoints at different locations in your code. A list of all breakpoints set in the code can be found in the BREAKPOINTS section. You can enable and disable individual or all breakpoints from there, without scrolling through the code.
Debug Toolbar

To get the code execution to the set breakpoint, we can use the debug toolbar where there are 6 buttons for controlling debugging.
- Continue
- This runs the code until a breakpoint is found. Since the code is currently paused, clicking this button will resume the execution.
- The keyboard shortcut for this function is F5.
- Step Over
- This progresses the execution to the next line in the code from where it is currently paused.
- Only the lines in the main code are stepped through. Subroutines inside libraries are excluded.
- The keyboard shortcut for this function is F10.
- Step Into
- This takes the debugger to the next line inside any subroutines.
- The keyboard shortcut for this function is F11.
- Step Out
- This will exit any subroutines we have previously entered and get us back to the main code.
- The keyboard shortcut for this function is Shift + F11.
- Restart
- This restarts the debugging from the starting point.
- The keyboard shortcut for this function is Ctrl + Shift + F5.
- Stop
- This stops the debugging session.
- The keyboard shortcut for this function is Shift + F5.
If we press the Continue button now, the code will pause at the breakpoint we set on line 17.
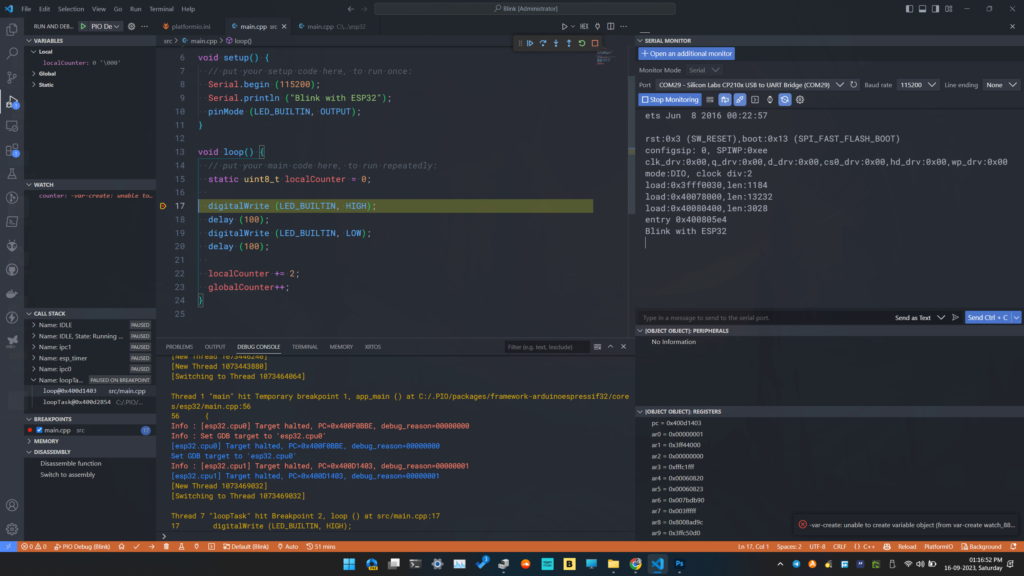
If we click the Continue button once again, the LED will blink once and the code will be paused at the same breakpoint again. Similarly, when you are debugging your own projects you can place breakpoints in the problematic section of code and observe what is happening.
Variable Inspection
Just pausing the CPU on some lines of code won’t be of much use. You need to be able to check the values of the variables, hardware registers, and other memory locations. You can do that with the VARIABLES section. It will list all the global and local variables available in the current scope and their values. If you want to monitor a particular variable, you can add that to a watch list shown by the WATCH section.
We have one global variable called globalCounter and one local static variable called localCounter. globalCounter is incremented by 1 every time the loop is run. Similarly, localCounter is incremented by 2 in every iteration of the loop. We can click the Continue button and observe their values change every time we hit the breakpoint. To add a variable to the watch list, simply right-click on the variable name and select Add to watch. The variable name will now appear on the watch list. We added both variables to the watch list as you can see from the screenshot below.
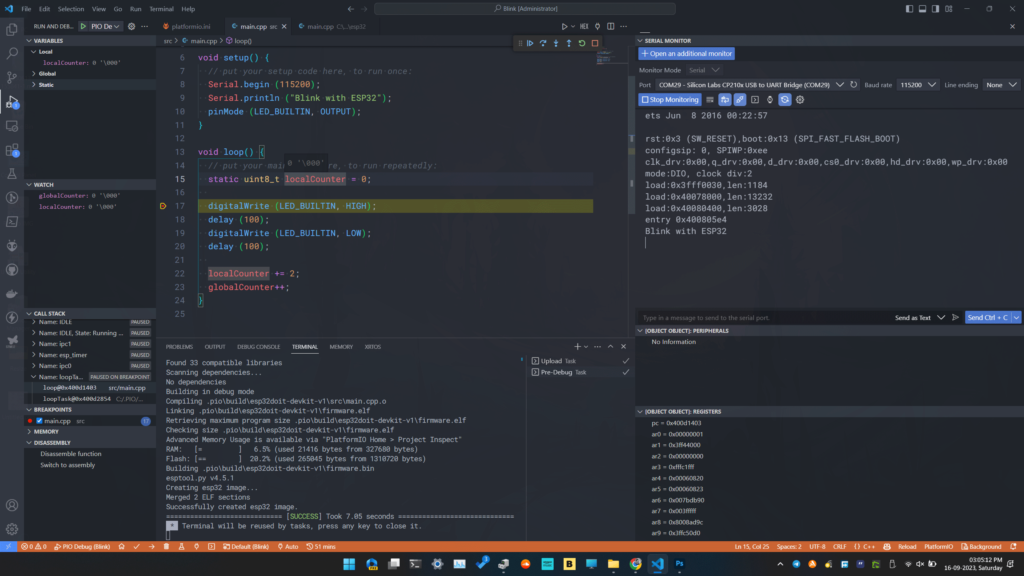
If we cycle the loop() function once, the value of gloablCounter becomes 1 and the localCounter becomes 2 as expected. The localCounter is a static variable and therefore the initialization line has no effect beyond the initial invocation. So the value of localCounter is preserved after each iteration. If localCounter was a non-static variable, we will always see the value of it as 0, since our breakpoint comes after the variable initialization line.
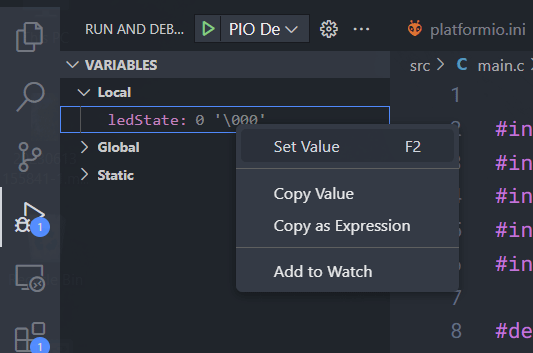
In addition to viewing the variable values, you can also change their values manually. You can right-click on a variable on the VARIABLES list and use the Set Value option to set a new value to the variable. This will have an immediate effect on your code.
Call Stack
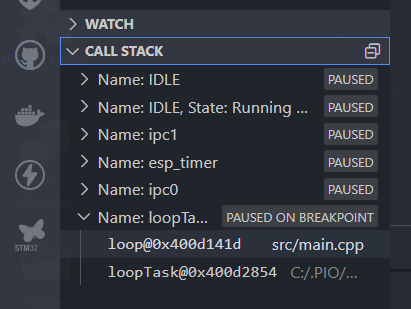
The next thing you can observe on the IDE is the CALL STACK which lists the functions, their addresses, locations in the file, and states. You can individually step through the functions if needed.
Register Inspection
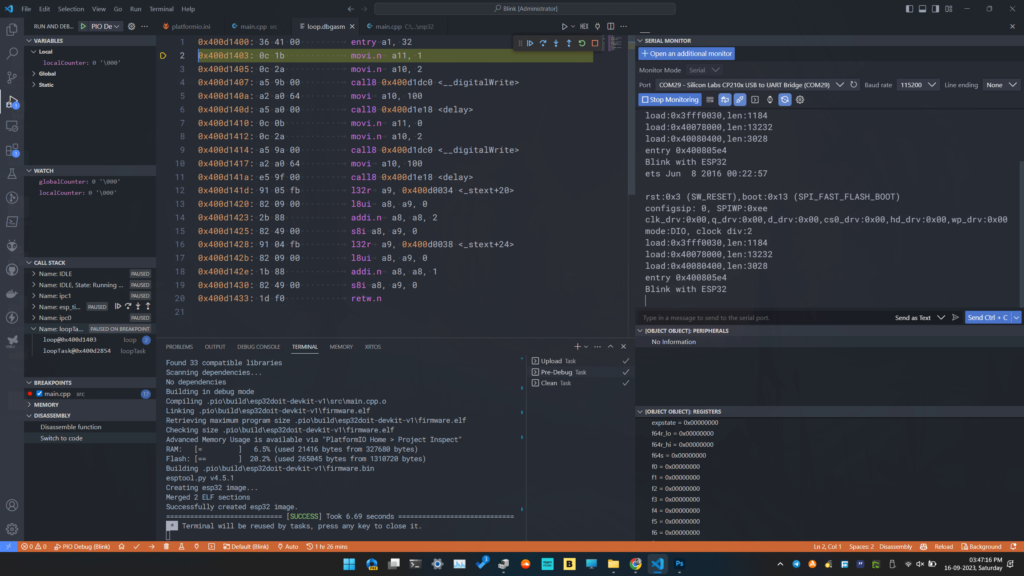
If you want to see the values of the internal hardware registers of the ESP32, you can find them in the REGISTERS section. This only contains the CPU-related registers. Registers related to the peripherals can be found in the PERIPHERALS section. Unfortunately, the peripheral registers (GPIO, I2C, SPI, etc.) are not visible at the moment due to an issue with ESP32 SVD file integration with PlatformIO.
Assembly View
Finally, you can switch to the disassembly view and have a look at the actual machine codes that are being executed. Clicking the Switch to assembly option in the DISASSEEMBLY section will take you to the .dbgasm files.
ESP-IDF
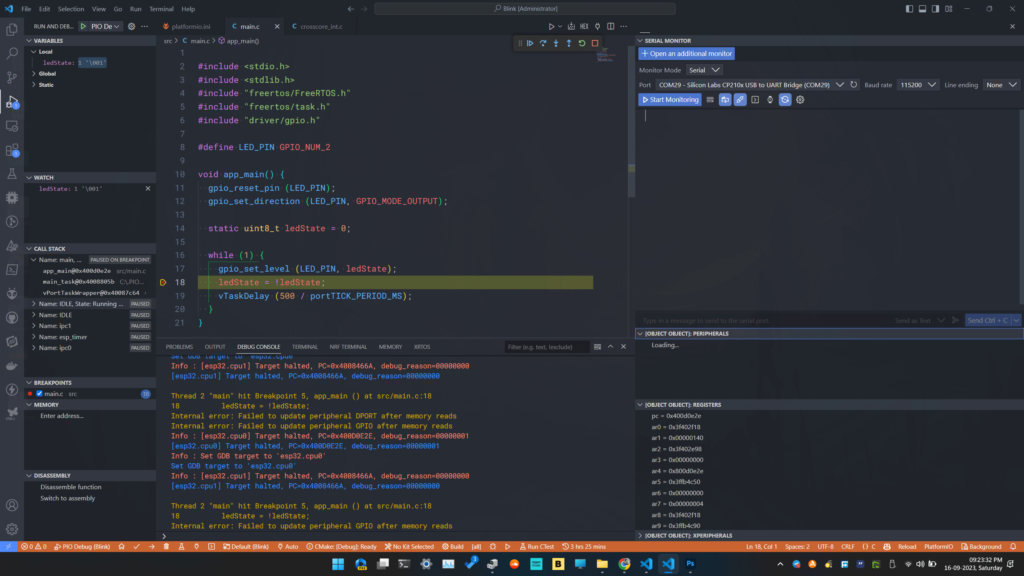
We will use the following program for the ESP-IDF debugging demo. You can choose ESP-IDF as the framework when creating a new PIO project.
#include <stdio.h>
#include <stdlib.h>
#include "freertos/FreeRTOS.h"
#include "freertos/task.h"
#include "driver/gpio.h"

#define LED_PIN GPIO_NUM_2

void app_main() {
  gpio_reset_pin (LED_PIN);
  gpio_set_direction (LED_PIN, GPIO_MODE_OUTPUT);

  static uint8_t ledState = 0;

  while (1) {
    gpio_set_level (LED_PIN, ledState);
    ledState = !ledState;
    vTaskDelay (500 / portTICK_PERIOD_MS);
  }
}The PIO configuration is shown below. The only change there is the framework.
[env:esp32doit-devkit-v1]
platform = espressif32
board = esp32doit-devkit-v1
framework = espidf
upload_protocol = esp-prog
debug_tool = esp-progAlmost everything about ESP-IDF debugging is similar to the Arduino code debugging we have shown previously. This is because the Arduino-ESP32 core uses ESP-IDF under the hood.
*  Executing task: C:\.PIO\penv\Scripts\platformio.exe run --target upload

Processing esp32doit-devkit-v1 (platform: espressif32; board: esp32doit-devkit-v1; framework: espidf)
----------------------------------------------------------------------------------------------------------------------------------------------------------------------------------------
Verbose mode can be enabled via `-v, --verbose` option
CONFIGURATION: https://docs.platformio.org/page/boards/espressif32/esp32doit-devkit-v1.html
PLATFORM: Espressif 32 (6.4.0+sha.4af2332) > DOIT ESP32 DEVKIT V1
HARDWARE: ESP32 240MHz, 320KB RAM, 4MB Flash
DEBUG: Current (esp-prog) External (cmsis-dap, esp-bridge, esp-prog, iot-bus-jtag, jlink, minimodule, olimex-arm-usb-ocd, olimex-arm-usb-ocd-h, olimex-arm-usb-tiny-h, olimex-jtag-tiny, tumpa)
PACKAGES:
 - framework-espidf @ 3.50101.230828 (5.1.1)
 - tool-cmake @ 3.16.4
 - tool-esptoolpy @ 1.40501.0 (4.5.1)
 - tool-idf @ 1.0.1
 - tool-mconf @ 1.4060000.20190628 (406.0.0)
 - tool-mkfatfs @ 2.0.1
 - tool-mklittlefs @ 1.203.210628 (2.3)
 - tool-mkspiffs @ 2.230.0 (2.30)
 - tool-ninja @ 1.9.0
 - tool-openocd-esp32 @ 2.1100.20220706 (11.0)
 - tool-riscv32-esp-elf-gdb @ 11.2.0+20220823
 - tool-xtensa-esp-elf-gdb @ 11.2.0+20230208
 - toolchain-esp32ulp @ 1.23500.220830 (2.35.0)
 - toolchain-xtensa-esp32 @ 12.2.0+20230208
Reading CMake configuration...
LDF: Library Dependency Finder -> https://bit.ly/configure-pio-ldf
LDF Modes: Finder ~ chain, Compatibility ~ soft
Found 0 compatible libraries
Scanning dependencies...
No dependencies
Building in release mode
Retrieving maximum program size .pio\build\esp32doit-devkit-v1\firmware.elf
Checking size .pio\build\esp32doit-devkit-v1\firmware.elf
Advanced Memory Usage is available via "PlatformIO Home > Project Inspect"
RAM:   [          ]   3.3% (used 10676 bytes from 327680 bytes)
Flash: [==        ]  17.3% (used 181549 bytes from 1048576 bytes)
Configuring upload protocol...
AVAILABLE: cmsis-dap, esp-bridge, esp-prog, espota, esptool, iot-bus-jtag, jlink, minimodule, olimex-arm-usb-ocd, olimex-arm-usb-ocd-h, olimex-arm-usb-tiny-h, olimex-jtag-tiny, tumpa
CURRENT: upload_protocol = esp-prog
Uploading .pio\build\esp32doit-devkit-v1\firmware.bin
Open On-Chip Debugger  v0.11.0-esp32-20220706 (2022-07-06-15:48)
Licensed under GNU GPL v2
For bug reports, read
        http://openocd.org/doc/doxygen/bugs.html
debug_level: 1

adapter speed: 20000 kHz

WARNING: boards/esp-wroom-32.cfg is deprecated, and may be removed in a future release.
adapter speed: 5000 kHz

Error: libusb_open() failed with LIBUSB_ERROR_NOT_SUPPORTED
** Programming Started **
** Programming Finished in 4195 ms **
** Verify Started **
** Verify OK **
** Programming Started **
** Programming Finished in 1324 ms **
** Verify Started **
** Verify OK **
** Programming Started **
** Programming Finished in 856 ms **
** Verify Started **
** Verify OK **
shutdown command invoked
============================================================================= [SUCCESS] Took 13.99 seconds =============================================================================
 *  Terminal will be reused by tasks, press any key to close it.
Reading symbols from D:\Code\PlatformIO\ESP32-IDF\Blink\.pio\build\esp32doit-devkit-v1\firmware.elf...
Warning: 'set target-async', an alias for the command 'set mi-async', is deprecated.
Use 'set mi-async'.

PlatformIO Unified Debugger -> https://bit.ly/pio-debug
PlatformIO: debug_tool = esp-prog
PlatformIO: Initializing remote target...
Warning: 'flushregs', an alias for the command 'maintenance flush register-cache', is deprecated.
Use 'maintenance flush register-cache'.

Open On-Chip Debugger  v0.11.0-esp32-20220706 (2022-07-06-15:48)
Licensed under GNU GPL v2
For bug reports, read
	http://openocd.org/doc/doxygen/bugs.html
adapter speed: 20000 kHz

WARNING: boards/esp-wroom-32.cfg is deprecated, and may be removed in a future release.
adapter speed: 5000 kHz

Info : tcl server disabled
Info : telnet server disabled
Error: libusb_open() failed with LIBUSB_ERROR_NOT_SUPPORTED
Info : clock speed 5000 kHz
Info : JTAG tap: esp32.cpu0 tap/device found: 0x120034e5 (mfg: 0x272 (Tensilica), part: 0x2003, ver: 0x1)
Info : JTAG tap: esp32.cpu1 tap/device found: 0x120034e5 (mfg: 0x272 (Tensilica), part: 0x2003, ver: 0x1)
Info : starting gdb server for esp32.cpu0 on pipe
Info : accepting 'gdb' connection from pipe
Info : [esp32.cpu0] Target halted, PC=0x4008466A, debug_reason=00000000
Info : Set GDB target to 'esp32.cpu0'
Info : [esp32.cpu1] Target halted, PC=0x4008466A, debug_reason=00000000
Warn : No symbols for FreeRTOS!
Info : [esp32.cpu0] Target halted, PC=0x40092612, debug_reason=00000001
Info : Flash mapping 0: 0x10020 -> 0x3f400020, 38 KB
Info : Flash mapping 1: 0x20020 -> 0x400d0020, 82 KB
Info : [esp32.cpu0] Target halted, PC=0x40092612, debug_reason=00000001
Info : Auto-detected flash bank 'esp32.cpu0.flash' size 4096 KB
Info : Using flash bank 'esp32.cpu0.flash' size 4096 KB
Info : [esp32.cpu0] Target halted, PC=0x40092612, debug_reason=00000001
Info : Flash mapping 0: 0x10020 -> 0x3f400020, 38 KB
Info : Flash mapping 1: 0x20020 -> 0x400d0020, 82 KB
Info : Using flash bank 'esp32.cpu0.irom' size 84 KB
Info : [esp32.cpu0] Target halted, PC=0x40092612, debug_reason=00000001
Info : Flash mapping 0: 0x10020 -> 0x3f400020, 38 KB
Info : Flash mapping 1: 0x20020 -> 0x400d0020, 82 KB
Info : Using flash bank 'esp32.cpu0.drom' size 40 KB
Info : New GDB Connection: 1, Target esp32.cpu0, state: halted
Warn : keep_alive() was not invoked in the 1000 ms timelimit. GDB alive packet not sent! (1026 ms). Workaround: increase "set remotetimeout" in GDB
0x4008466a in esp_cpu_wait_for_intr () at C:\.PIO\packages\framework-espidf\components\esp_hw_support\cpu.c:121
121	}
Info : Detected FreeRTOS version: (10.4.3)
Info : JTAG tap: esp32.cpu0 tap/device found: 0x120034e5 (mfg: 0x272 (Tensilica), part: 0x2003, ver: 0x1)
Info : JTAG tap: esp32.cpu1 tap/device found: 0x120034e5 (mfg: 0x272 (Tensilica), part: 0x2003, ver: 0x1)
JTAG tap: esp32.cpu0 tap/device found: 0x120034e5 (mfg: 0x272 (Tensilica), part: 0x2003, ver: 0x1)
Info : [esp32.cpu0] requesting target halt and executing a soft reset
JTAG tap: esp32.cpu1 tap/device found: 0x120034e5 (mfg: 0x272 (Tensilica), part: 0x2003, ver: 0x1)
[esp32.cpu0] requesting target halt and executing a soft reset
Info : [esp32.cpu0] Debug controller was reset.
Info : [esp32.cpu0] Core was reset.
Info : [esp32.cpu0] Target halted, PC=0x500000CF, debug_reason=00000000
[esp32.cpu0] Debug controller was reset.
[esp32.cpu0] Core was reset.
[esp32.cpu0] Target halted, PC=0x500000CF, debug_reason=00000000
Info : [esp32.cpu1] requesting target halt and executing a soft reset
Info : [esp32.cpu0] Core was reset.
[esp32.cpu1] requesting target halt and executing a soft reset
[esp32.cpu0] Core was reset.
Info : [esp32.cpu0] Target halted, PC=0x40000400, debug_reason=00000000
Info : [esp32.cpu1] Debug controller was reset.
Info : [esp32.cpu1] Core was reset.
[esp32.cpu0] Target halted, PC=0x40000400, debug_reason=00000000
[esp32.cpu1] Debug controller was reset.
[esp32.cpu1] Core was reset.
Info : [esp32.cpu1] Target halted, PC=0x40000400, debug_reason=00000000
[esp32.cpu1] Target halted, PC=0x40000400, debug_reason=00000000
Info : [esp32.cpu0] Target halted, PC=0x40092612, debug_reason=00000001
Info : Flash mapping 0: 0x10020 -> 0x3f400020, 38 KB
Info : Flash mapping 1: 0x20020 -> 0x400d0020, 82 KB
[esp32.cpu0] Target halted, PC=0x40092612, debug_reason=00000001
Flash mapping 0: 0x10020 -> 0x3f400020, 38 KB
Flash mapping 1: 0x20020 -> 0x400d0020, 82 KB
Info : [esp32.cpu0] Target halted, PC=0x40092612, debug_reason=00000001
Info : Auto-detected flash bank 'esp32.cpu1.flash' size 4096 KB
Info : Using flash bank 'esp32.cpu1.flash' size 4096 KB
[esp32.cpu0] Target halted, PC=0x40092612, debug_reason=00000001
Auto-detected flash bank 'esp32.cpu1.flash' size 4096 KB
Using flash bank 'esp32.cpu1.flash' size 4096 KB
** Programming Started **
** Programming Started **
Info : [esp32.cpu0] Target halted, PC=0x40092612, debug_reason=00000001
[esp32.cpu0] Target halted, PC=0x40092612, debug_reason=00000001
Info : [esp32.cpu0] Target halted, PC=0x40092612, debug_reason=00000001
Info : PROF: Erased 28672 bytes in 500.528 ms
[esp32.cpu0] Target halted, PC=0x40092612, debug_reason=00000001
PROF: Erased 28672 bytes in 500.528 ms
PROF: Wrote 28672 bytes in 509.837 ms (data transfer time included)
** Programming Finished in 1660 ms **
** Verify Started **
** Programming Finished in 1660 ms **
** Verify Started **
Info : [esp32.cpu0] Target halted, PC=0x40092612, debug_reason=00000001
Info : PROF: Flash verified in 128.427 ms
** Verify OK **
[esp32.cpu0] Target halted, PC=0x40092612, debug_reason=00000001
PROF: Flash verified in 128.427 ms
** Verify OK **
Info : JTAG tap: esp32.cpu0 tap/device found: 0x120034e5 (mfg: 0x272 (Tensilica), part: 0x2003, ver: 0x1)
Info : JTAG tap: esp32.cpu1 tap/device found: 0x120034e5 (mfg: 0x272 (Tensilica), part: 0x2003, ver: 0x1)
JTAG tap: esp32.cpu0 tap/device found: 0x120034e5 (mfg: 0x272 (Tensilica), part: 0x2003, ver: 0x1)
Info : [esp32.cpu0] requesting target halt and executing a soft reset
JTAG tap: esp32.cpu1 tap/device found: 0x120034e5 (mfg: 0x272 (Tensilica), part: 0x2003, ver: 0x1)
[esp32.cpu0] requesting target halt and executing a soft reset
Info : [esp32.cpu0] Debug controller was reset.
Info : [esp32.cpu0] Core was reset.
Info : [esp32.cpu0] Target halted, PC=0x500000CF, debug_reason=00000000
[esp32.cpu0] Debug controller was reset.
[esp32.cpu0] Core was reset.
[esp32.cpu0] Target halted, PC=0x500000CF, debug_reason=00000000
Info : [esp32.cpu1] requesting target halt and executing a soft reset
Info : [esp32.cpu0] Core was reset.
[esp32.cpu1] requesting target halt and executing a soft reset
[esp32.cpu0] Core was reset.
Info : [esp32.cpu0] Target halted, PC=0x40000400, debug_reason=00000000
Info : [esp32.cpu1] Debug controller was reset.
Info : [esp32.cpu1] Core was reset.
[esp32.cpu0] Target halted, PC=0x40000400, debug_reason=00000000
[esp32.cpu1] Debug controller was reset.
[esp32.cpu1] Core was reset.
Info : [esp32.cpu1] Target halted, PC=0x40000400, debug_reason=00000000
[esp32.cpu1] Target halted, PC=0x40000400, debug_reason=00000000
** Programming Started **
** Programming Started **
Info : [esp32.cpu0] Target halted, PC=0x40092612, debug_reason=00000001
[esp32.cpu0] Target halted, PC=0x40092612, debug_reason=00000001
Info : [esp32.cpu0] Target halted, PC=0x40092612, debug_reason=00000001
[esp32.cpu0] Target halted, PC=0x40092612, debug_reason=00000001
Info : PROF: Flash verified in 118.658 ms
** Verify OK **
PROF: Flash verified in 118.658 ms
** Verify OK **
Info : JTAG tap: esp32.cpu0 tap/device found: 0x120034e5 (mfg: 0x272 (Tensilica), part: 0x2003, ver: 0x1)
Info : JTAG tap: esp32.cpu1 tap/device found: 0x120034e5 (mfg: 0x272 (Tensilica), part: 0x2003, ver: 0x1)
JTAG tap: esp32.cpu0 tap/device found: 0x120034e5 (mfg: 0x272 (Tensilica), part: 0x2003, ver: 0x1)
JTAG tap: esp32.cpu1 tap/device found: 0x120034e5 (mfg: 0x272 (Tensilica), part: 0x2003, ver: 0x1)
Info : [esp32.cpu0] requesting target halt and executing a soft reset
[esp32.cpu0] requesting target halt and executing a soft reset
Info : [esp32.cpu0] Debug controller was reset.
Info : [esp32.cpu0] Core was reset.
Info : [esp32.cpu0] Target halted, PC=0x500000CF, debug_reason=00000000
[esp32.cpu0] Debug controller was reset.
[esp32.cpu0] Core was reset.
[esp32.cpu0] Target halted, PC=0x500000CF, debug_reason=00000000
Info : [esp32.cpu1] requesting target halt and executing a soft reset
Info : [esp32.cpu0] Core was reset.
[esp32.cpu1] requesting target halt and executing a soft reset
[esp32.cpu0] Core was reset.
Info : [esp32.cpu0] Target halted, PC=0x40000400, debug_reason=00000000
Info : [esp32.cpu1] Debug controller was reset.
Info : [esp32.cpu1] Core was reset.
[esp32.cpu0] Target halted, PC=0x40000400, debug_reason=00000000
[esp32.cpu1] Debug controller was reset.
[esp32.cpu1] Core was reset.
Info : [esp32.cpu1] Target halted, PC=0x40000400, debug_reason=00000000
[esp32.cpu1] Target halted, PC=0x40000400, debug_reason=00000000
Info : PROF: Wrote 184320 bytes in 1451.78 ms (data transfer time included)
[esp32.cpu0] Target halted, PC=0x40092612, debug_reason=00000001
PROF: Wrote 184320 bytes in 1451.78 ms (data transfer time included)
** Programming Finished in 3724 ms **
** Verify Started **
** Programming Finished in 3724 ms **
** Verify Started **
Info : [esp32.cpu0] Target halted, PC=0x40092612, debug_reason=00000001
Info : PROF: Flash verified in 208.998 ms
** Verify OK **
[esp32.cpu0] Target halted, PC=0x40092612, debug_reason=00000001
PROF: Flash verified in 208.998 ms
** Verify OK **
Info : JTAG tap: esp32.cpu0 tap/device found: 0x120034e5 (mfg: 0x272 (Tensilica), part: 0x2003, ver: 0x1)
Info : JTAG tap: esp32.cpu1 tap/device found: 0x120034e5 (mfg: 0x272 (Tensilica), part: 0x2003, ver: 0x1)
JTAG tap: esp32.cpu0 tap/device found: 0x120034e5 (mfg: 0x272 (Tensilica), part: 0x2003, ver: 0x1)
Info : [esp32.cpu0] requesting target halt and executing a soft reset
JTAG tap: esp32.cpu1 tap/device found: 0x120034e5 (mfg: 0x272 (Tensilica), part: 0x2003, ver: 0x1)
[esp32.cpu0] requesting target halt and executing a soft reset
Info : [esp32.cpu0] Debug controller was reset.
Info : [esp32.cpu0] Core was reset.
Info : [esp32.cpu0] Target halted, PC=0x500000CF, debug_reason=00000000
[esp32.cpu0] Debug controller was reset.
[esp32.cpu0] Core was reset.
[esp32.cpu0] Target halted, PC=0x500000CF, debug_reason=00000000
Info : [esp32.cpu1] requesting target halt and executing a soft reset
Info : [esp32.cpu0] Core was reset.
[esp32.cpu1] requesting target halt and executing a soft reset
[esp32.cpu0] Core was reset.
Info : [esp32.cpu0] Target halted, PC=0x40000400, debug_reason=00000000
Info : [esp32.cpu1] Debug controller was reset.
Info : [esp32.cpu1] Core was reset.
[esp32.cpu0] Target halted, PC=0x40000400, debug_reason=00000000
[esp32.cpu1] Debug controller was reset.
[esp32.cpu1] Core was reset.
Info : [esp32.cpu1] Target halted, PC=0x40000400, debug_reason=00000000
[esp32.cpu1] Target halted, PC=0x40000400, debug_reason=00000000
Note: automatically using hardware breakpoints for read-only addresses.
Internal error: Failed to update peripheral GPIO after memory reads
PlatformIO: Resume the execution to `debug_init_break = thb app_main`
PlatformIO: More configuration options -> https://bit.ly/pio-debug
Info : [esp32.cpu0] Target halted, PC=0x400D0E17, debug_reason=00000001
Info : Set GDB target to 'esp32.cpu0'
[esp32.cpu0] Target halted, PC=0x400D0E17, debug_reason=00000001
Set GDB target to 'esp32.cpu0'
Info : [esp32.cpu1] Target halted, PC=0x4008466A, debug_reason=00000000
[esp32.cpu1] Target halted, PC=0x4008466A, debug_reason=00000000
Info : Detected FreeRTOS version: (10.4.3)
[New Thread 1073413024]
[New Thread 1073413712]
[New Thread 1073413368]
[New Thread 1073412272]
[New Thread 1073412616]
[New Thread 1073410900]
[Switching to Thread 1073413024]

Thread 2 "main" hit Temporary breakpoint 1, app_main () at src/main.c:11
11	  gpio_reset_pin (LED_PIN);
Internal error: Failed to update peripheral GPIO after memory readsTroubleshooting
Debugging is not without its own bugs! Sometimes the debugging session can hang or stop abruptly if something goes wrong in the background. This can be due to the target being non-responsive or some other issue. We have a few tips for you to troubleshoot such issues.
Learn More
The goal of this tutorial was to give you an introduction to embedded debugging using ESP-Prog and PlatformIO. But we have only scratched the surface of debugging. There are many more techniques, tools, and other protocols for debugging. In our upcoming posts, we will cover OpenOCD, GDB, and other debugging tools in detail. Meanwhile, you can learn more about ESP32 debugging from the official documentation. A great of information is available on the JTAG Debugging tutorial from Espressif and the PlatformIO debugging tutorial. If you found any mistakes in this tutorial or know how to improve this post, please let us know in the comments.
Links
- DOIT ESP32 DevKit V1 Wi-Fi Development Board – Pinout Diagram & Arduino Reference
- Getting Started with Espressif ESP32 Wi-Fi & Bluetooth SoC using DOIT-ESP32-DevKit-V1 Development Board
- ESP-Prog Official Documentation
- ESP-Prog Schematic [PDF]
- FTDI FT2232HL – Product Page
- FTDI VCP Drivers
- Zadig USB Driver Installer
- PlatformIO – Homepage
- OpenOCD – Official Website
- GDB – Homepage
- ESP32 JTAG Debugging Documentation
- PlatformIO Debugging Tutorial
- Introduction to JTAG and the Test Access Port (TAP) – All About Circuits
- The JTAG Test Access Port (TAP) State Machine – All About Circuits
- Low-cost ESP32 In-circuit Debugging – Manuel Bl.
Short Link
- Short URL to this page – https://www.circuitstate.com/espprogesp32

