Upside Down Labs BioAmp EXG Pill v0.7 Biopotential AFE: Hardware Overview and Interfacing with Arduino
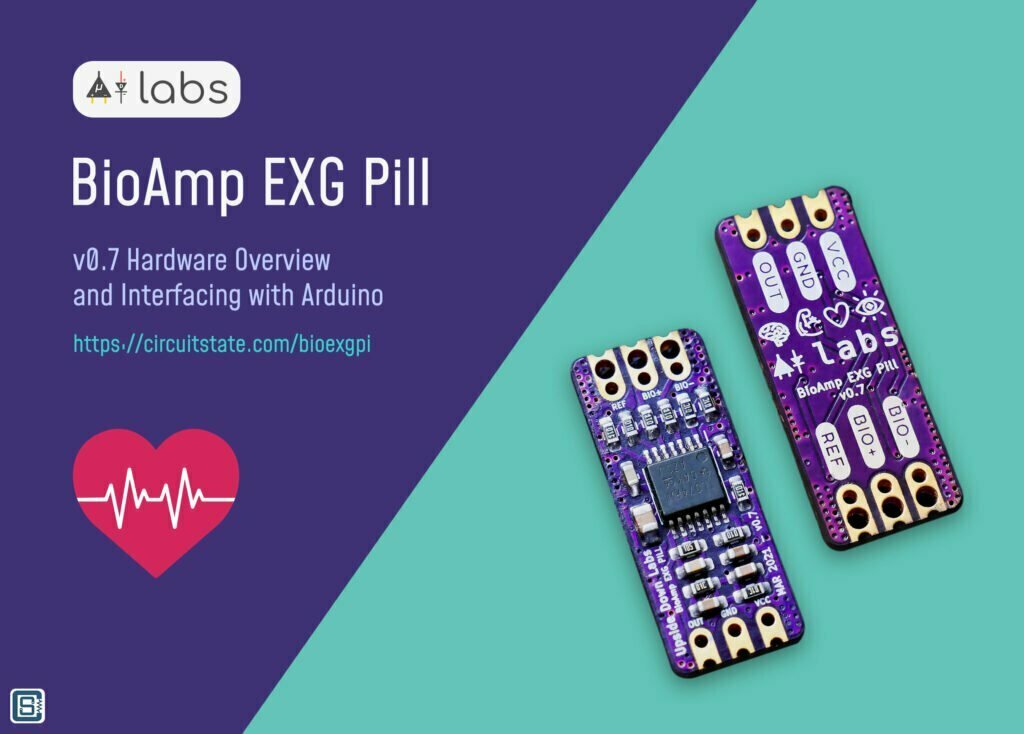
We had featured Upside Down Labs’ BioAmp EXG Pill in a previous post. EXG Pill is a biopotential Analog Front-End (AFE) designed to sense and amplify physiological signals produced by our body. Physiological signals are low-magnitude electrical signals that control various functions of living bodies such as the functioning of the heart and muscles. Depending on the nature of these signals, they are classified as ECG, EEG, EMG, etc. With the help of electrodes placed on the body, BioAmp EXG Pill can pick up these feeble signals and amplify them. The amplified signals can be then be fed to a microcontroller to control various input and output devices. Think of turning on a light with your mind, opening a door, or controlling a robotic arm or drone. All that, and many more is possible by non-invasively tapping into our body’s electrical signals.
The awesome people at UDL had sent us two of their BioAmp EXG Pill v0.7 modules for testing. We will test and review them in this post. At the time of writing this post, version 1.0 of the BioAmp EXG Pill is already running a crowdfunding campaign at Crowd Supply. BioAmp EXG Pill is a fully open-source hardware project.
Specifications of BioAmp EXG Pill v0.7
- Working Voltage: 5 V – 40 V
- Input Impedance: > 35 MΩ
- Compatible Hardware: Any 5 V MCU/ADC
- Supported Biopotentials Voltages: ECG, EOG, EMG, and EEG (Configurable)
- No. of channels: 1
- Electrodes: 2/3 (Configurable)
- Dimensions: 25.4 x 10.0 mm
- Open Source: Hardware + Software
- Castellated PCB: Yes
Kit Contents
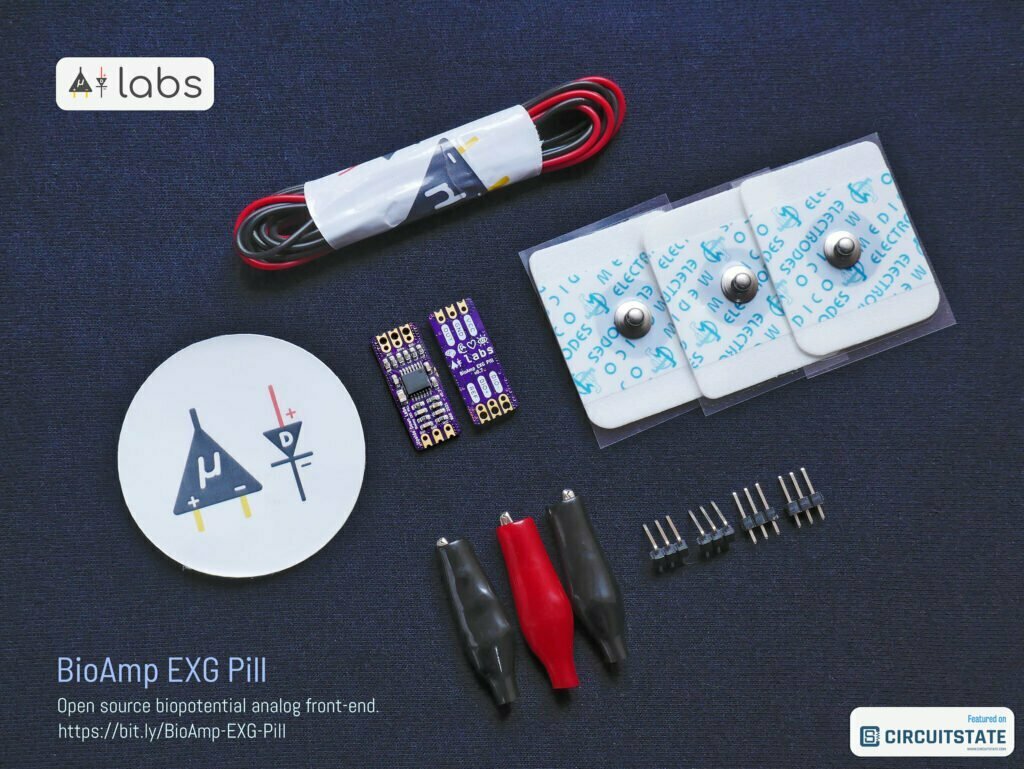
- 1/2 x EXG Pill boards
- 1 x Red Crocodile Clip
- 2 x Black Crocodile Clips
- 2 x 3-Pin Straight Header Pins (2.54 mm)
- 2 x 3-Pin Right-angle Header Pins (2.54 mm)
- 1 x Red Multi-stranded Wire
- 2 x Black Multi-stranded Wire
- 3 x Rectangular Gel Electrodes
Schematic
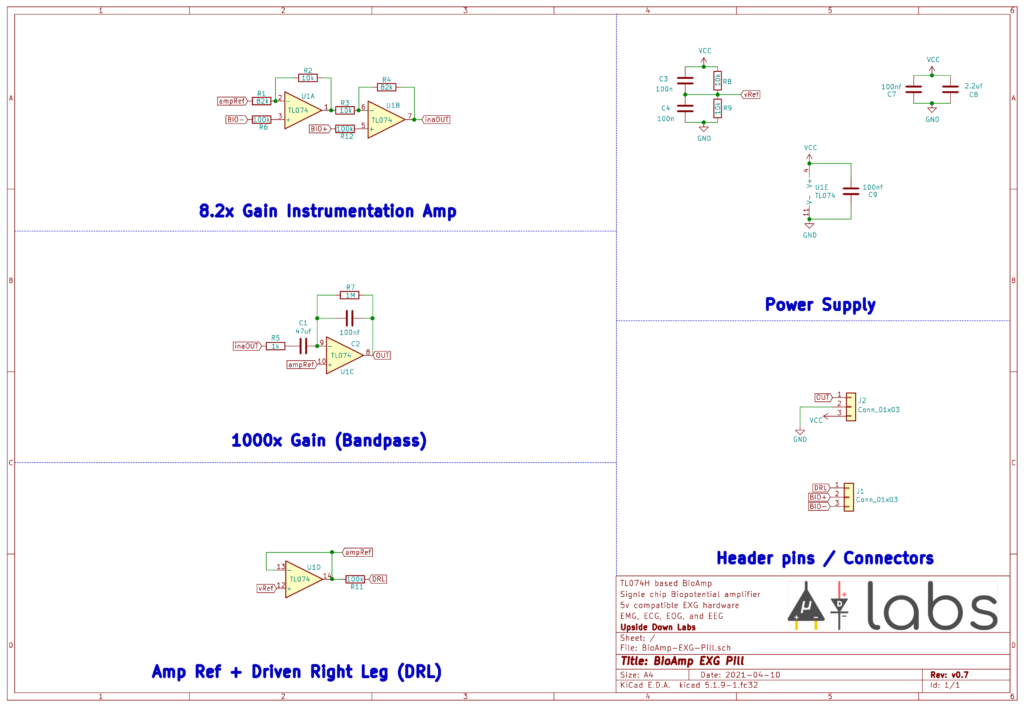
Click the image to expand.
We are a little short of official documentation on the aspects of the design here. We don’t know exactly how the design choices were made, and how they were tested. But UDL keeps improving this design and let’s hope they release more hardware documentation in the future. For now, we will make our best guesses on how everything works.

The center of the design is the Texas Instruments TL074 quad low-noise JFET-input general-purpose operational amplifier in a TSSOP-14 package. TL074 is a 40+ years old op-amp that is still in production and in wide use. There is a new version available though, the TL074H.
Specifications of TL074
- Number of channels: 4
- Total supply voltage (Max): (+5V=5, +/-5V=10) 30 V
- Total supply voltage (Min): (+5V=5, +/-5V=10) 7 V
- Rail-to-rail: In to V+
- GBW: 3 MHz
- Slew rate: 13 V/us
- Vos (offset voltage @ 25 C) (Max): 6 mV
- Iq per channel: 1.4 mA
- Vn at 1 kHz: 18 nV/rtHz
- Operating temperature range: -40 to 85 °C
- Offset drift: 18 uV/C
- Input bias current (Max): 200 pA
- CMRR: 100 dB
- Output current: 10 mA
- Architecture: FET
The circuit for the instrumentation amp does not seem to be a standard design, but a modified one. In a standard INA design, two emitter-followers will be used as buffer amplifiers that offer high input impedance and the configuration offers better CMRR and differential gain. The standard design is modified in EXG Pill for some purpose, we assume. BIO- is the inverting input and BIO+ is the non-inverting input, which is not balanced due to, again, a modified design. The ampRef is amplifier reference which supposedly sets the idle output at the mid-point (half-level) of the supply voltage. The output inaOut is fed back to a differential gain amplifier.

The differential gain amplifier accepts the input from the buffer amplifiers and the ampRef. An input filter (R5 and C1) is used to block DC and R7 and C2 set the gain and frequency range. Thus we have two filters, and they allow only the passband to go through, filtering out other noises. In fact, the passband range is very narrow.
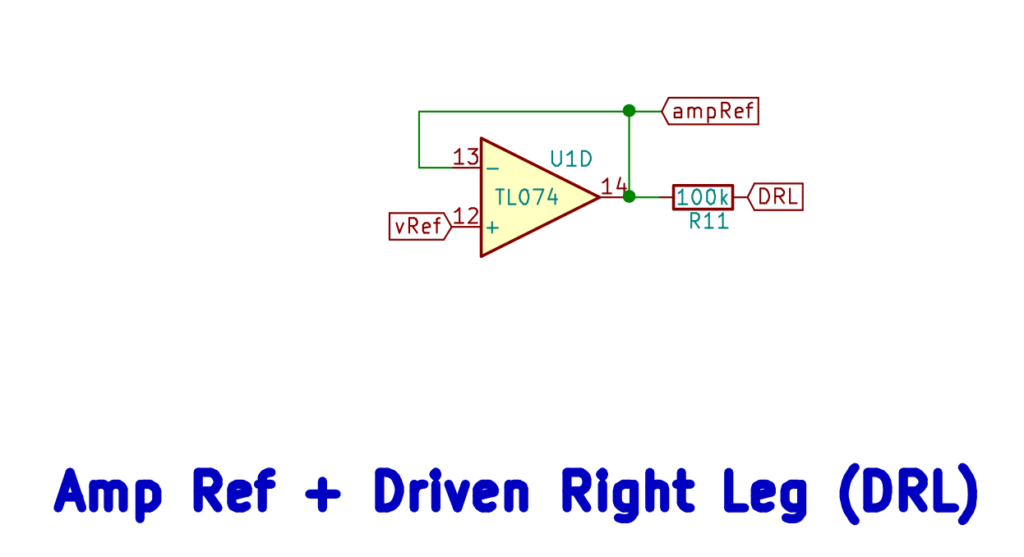
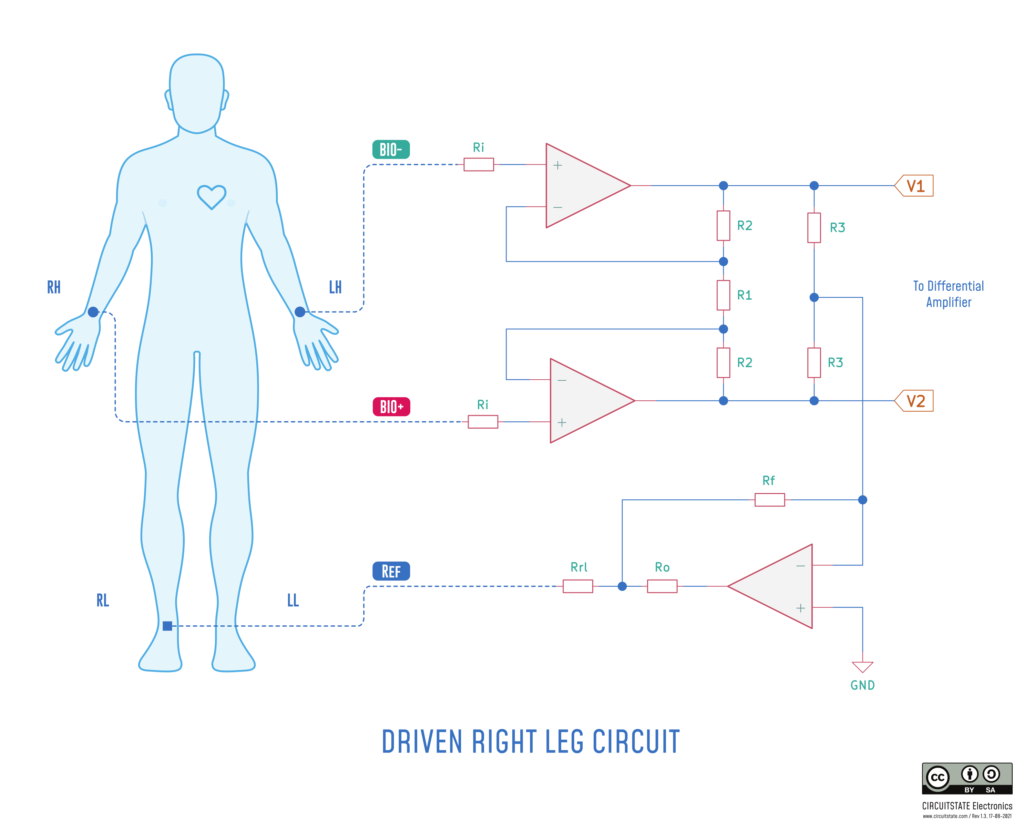
A fourth op-amp forms an emitter-follower or voltage-follower which derives a mid-point voltage for full output swing. vRef is a 2.5V coming from a simple voltage divider. The output is also used to drive the right leg. Driven Right Leg is a method used in bio-signal amplifier designs to eliminate common-mode signals. Bio-signal amplifier measures millivolt or microvolt ranges of voltages, and thus are sensitive to every small interference. The human body itself can act as an antenna, picking up signals and causing a voltage to develop across it. If you measure between two different points on the body, they will register a voltage with reference to Earth/Ground. The mains supply is one such source of interference, inducing 50/60Hz noise.
Click to open the image viewer.
These types of unwanted signals can be eliminated by sampling the common-mode voltage, amplifying it, and then feeding it back to the body. This acts as a negative feedback, thus essentially nullifying the unwanted signals. The right leg is chosen since it is the farthest from the heart where signals like ECG are concentrated. The DRL input has to be connected someplace away from the BIO- and BIO+ inputs, usually towards the right side of your body.

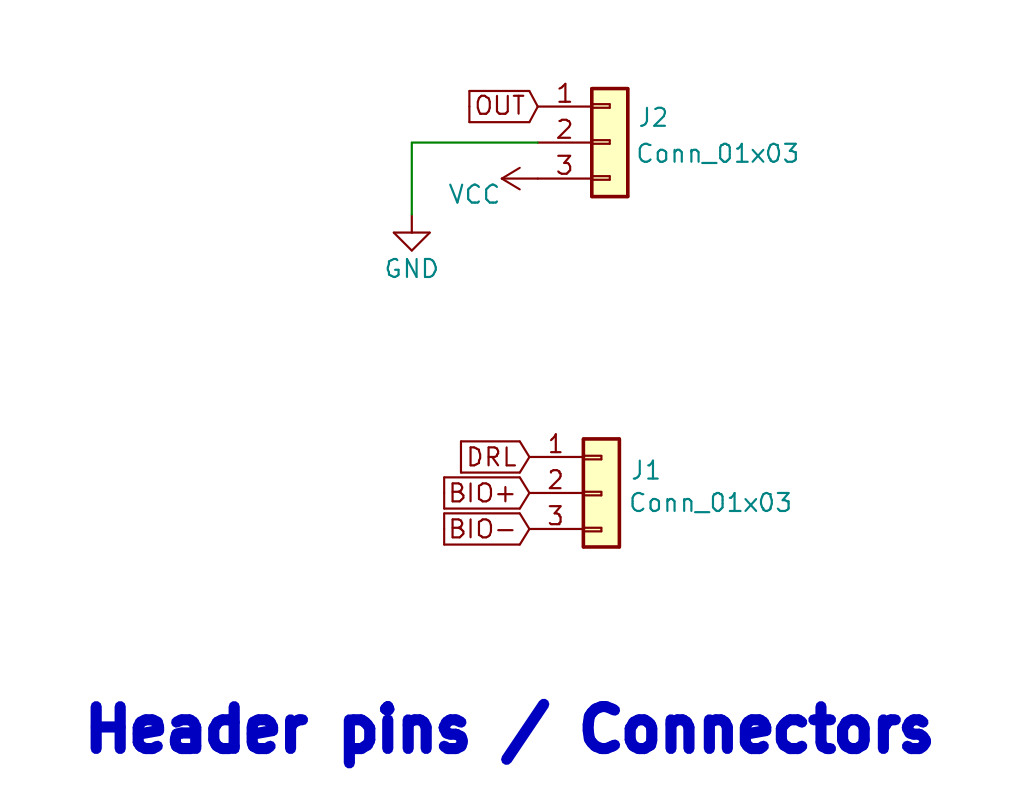
The remaining portion of the circuit is decoupling capacitors, vRef voltage divider and the output connectors.
PCB
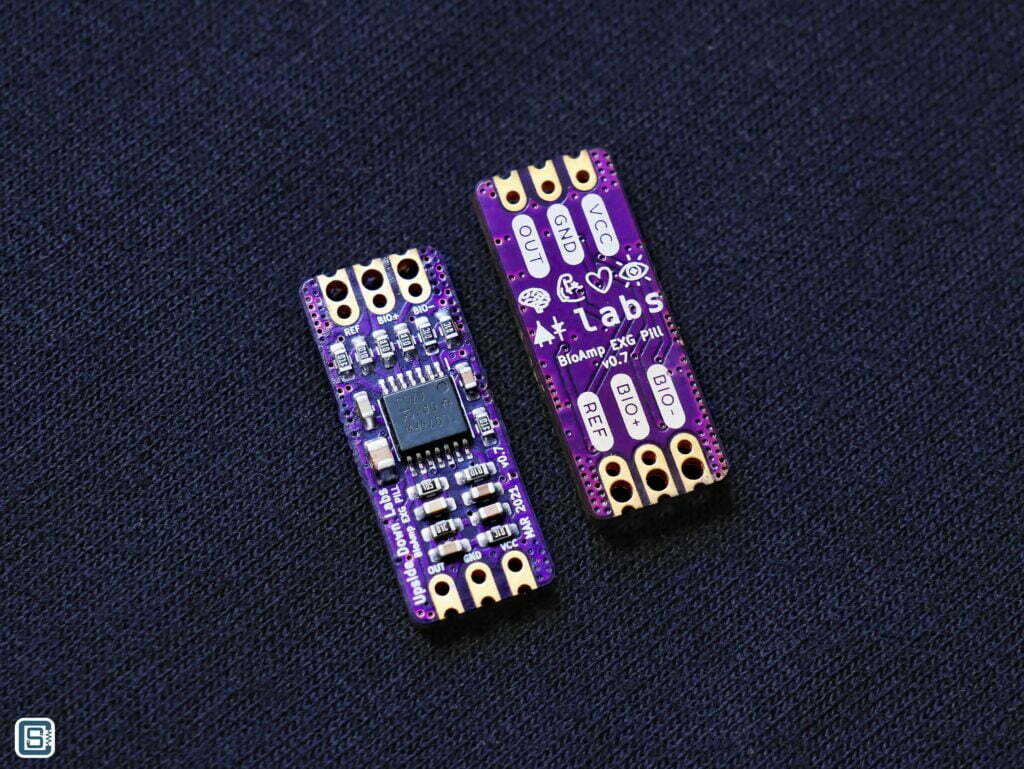
The PCBs were designed in KiCad open-source EDA software and the design files are free to download. The PCB has two layers, 1.6mm thickness, and all the components are arranged on one side. The beautiful purple PCBs were manufactured by OSH Park, USA, and the quality is excellent as always. The connectors are conveniently placed on the ends. The PCBs are tinier than you would expect, with the size of a pill. Make sure you don’t lose them 😉
Wiring
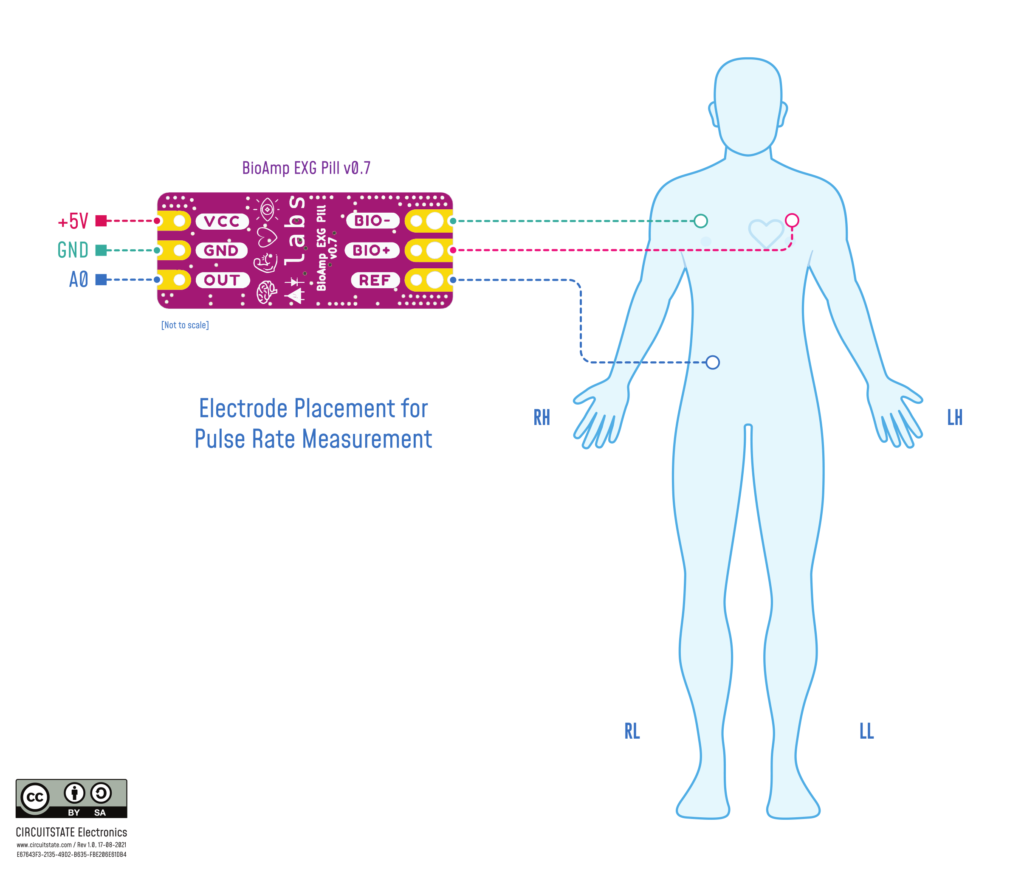
No wiring instructions are provided by UDL as to where to place the electrodes etc, for each example. But you can follow the standard electrode placements depending on the application. Also, there are some demo videos from UDL, from which you can determine the best placement.
For this post, we will be placing the three gel electrodes on the right hand to detect EMG and on the chest for pulse count. The gel electrodes are one-time use only, but we will use them a few times. Gel electrodes are easily available if you want to buy them. As the name suggests, these electrodes have a layer of hydrogel that facilitates better contact of the metal electrodes with the skin of a patient. The electrode adhesive has a short gap at one end without any adhesive. This is to make it easy to remove the electrode easily from the body. Make sure you place that side away from the direction of the body hair on the skin, to prevent any ouchy moments.
Click to open the image viewer.
Image CC-BY-SA
You can either solder header pins (provided) or solder the wires directly to the board. If soldering the wires, you can loop them through the larger holes on the input signal side of the PCB. We soldered right-angle header pins and soldered a 3-pin receptacle to the wire ends. The power supply pins can be directly connected to your 5V microcontroller board. We are using Arduino Uno for this test and used the onboard 5V supply for the EXG Pill. The analog output of the module is connected to A0 pin of the Arduino.
Example Code
There are multiple example codes available at the UDL GitHub repository. Below is a list of examples available,
| No. | Program | Description |
|---|---|---|
| 1 | FixedSampling | Sample from ADC at a fixed rate for easy processing of the signal. |
| 2 | EMGFilter | A 74.5 – 149.5 Hz bandpass filter sketch for clean Electromyography. |
| 3 | ECGFilter | A 0.5 – 44.5 Hz band-pass filter sketch for clean Electrocardiography. |
| 4 | EOGFilter | A 0.5 – 19.5 Hz band-pass filter sketch for clean Electrooculography. |
| 5 | EEGFilter | A 0.5 – 29.5 Hz band-pass filter sketch for clean Electroencephalography. |
| 6 | EMGEnvelop | EMG signal envelop detection for robotics and biomedical applications. |
| 7 | LEDBarGraph | LED bar graph showing EMG amplitude. |
| 8 | ServoControl | Servo motor control with EMG. |
| 9 | HeartBeatDetection | Standard deviation-based heartbeat detection algorithm. |
| 10 | EyeBlinkDetection | EOG based eye blink detection. |
| 11 | DrowsinessDetection | Drowsiness detection using eye blink detection. |
| 12 | ClawController | Servo claw controller |
Testing
We will use the Heart Beat Detection (Pulse Rate) example and the wiring shown before. I placed the electrodes on my chest so that I could move my hands while doing this. The demo video from UDL shows the electrodes placed on the wrists. Let’s look at the code first.
#include <math.h>

#define SampleRate 125
#define BaudRate 115200
#define inputPin A0
#define window 16

int index = 0;
int peak = 0;

void setup() {
  // Serial connection begin
  Serial.begin(BaudRate);
  // Setup Input & Output pin
  pinMode(inputPin, INPUT);
  pinMode(LED_BUILTIN, OUTPUT);
}

void loop() {
  // Calculate elapsed time
  static unsigned long past = 0;
  unsigned long present = micros();
  unsigned long interval = present - past;
  past = present;

  // Run timer
  static long timer = 0;
  timer -= interval;

  // Sample
  if (timer < 0) {
    timer += 1000000 / SampleRate;
    // Sample and Nomalize input data (-1 to 1)
    float sensorValue = analogRead(inputPin);
    float ECGSignal = ECGFilter(sensorValue) / 512;
    // Get peak
    int peak = getPeak(ECGSignal);
    // Print sensorValue and peak
    Serial.print(ECGSignal);
    Serial.print(",");
    Serial.println(peak);
    // Blink LED on peak
    digitalWrite(LED_BUILTIN, peak);
  }
}

int getPeak(float newSample) {
  // Buffers for data, mean, and standard deviation
  static float dataBuffer[window];
  static float meanBuffer[window];
  static float standardDeviationBuffer[window];

  // Check for peak
  if (newSample - meanBuffer[index] > (window / 2) * standardDeviationBuffer[index]) {
    dataBuffer[index] = newSample + dataBuffer[index];
    peak = 1;
  }
  else {
    dataBuffer[index] = newSample;
    peak = 0;
  }

  // Calculate mean
  float sum = 0.0, mean, standardDeviation = 0.0;

  for (int i = 0; i < window; ++i) {
    sum += dataBuffer[(index + i) % window];
  }
  mean = sum / window;

  // Calculate standard deviation
  for (int i = 0; i < window; ++i) {
    standardDeviation += pow(dataBuffer[(i) % window] - mean, 2);
  }

  // Update mean buffer
  meanBuffer[index] = mean;

  // Update standard deviation buffer
  standardDeviationBuffer[index] = sqrt(standardDeviation / window);

  // Update index
  index = (index + 1) % window;

  // Return peak
  return peak;
}

// Band-Pass Butterworth IIR digital filter, generated using filter_gen.py.
// Sampling rate: 125.0 Hz, frequency: [0.5, 44.5] Hz.
// Filter is order 4, implemented as second-order sections (biquads).
// Reference:
// https://docs.scipy.org/doc/scipy/reference/generated/scipy.signal.butter.html
// https://courses.ideate.cmu.edu/16-223/f2020/Arduino/FilterDemos/filter_gen.py
float ECGFilter(float input) {
  float output = input;
  {
    static float z1, z2; // filter section state
    float x = output - 0.70682283 * z1 - 0.15621030 * z2;
    output = 0.28064917 * x + 0.56129834 * z1 + 0.28064917 * z2;
    z2 = z1;
    z1 = x;
  }
  {
    static float z1, z2; // filter section state
    float x = output - 0.95028224 * z1 - 0.54073140 * z2;
    output = 1.00000000 * x + 2.00000000 * z1 + 1.00000000 * z2;
    z2 = z1;
    z1 = x;
  }
  {
    static float z1, z2; // filter section state
    float x = output - -1.95360385 * z1 - 0.95423412 * z2;
    output = 1.00000000 * x + -2.00000000 * z1 + 1.00000000 * z2;
    z2 = z1;
    z1 = x;
  }
  {
    static float z1, z2; // filter section state
    float x = output - -1.98048558 * z1 - 0.98111344 * z2;
    output = 1.00000000 * x + -2.00000000 * z1 + 1.00000000 * z2;
    z2 = z1;
    z1 = x;
  }
  return output;
}There’s no code explanation available from UDL, but we will try to make our best guess again. The EXG Pill has a fixed analog bandpass filter. This allows only a certain range of frequencies of signal to pass through the circuit and reach the output. Multiple capacitors and resistors form this filter network and their values determine the frequency response. The values for the filters are chosen so as to only allow frequencies of the biological signals we are interested in. This means all the other unwanted interferences such as mains noise will be blocked. This is a crucial design aspect of any system design that has to sample important signals from a noisy environment.
In addition to the analog filters, we can also implement signal filters digitally in the form of IIR (Infinite Impulse Response) and FIR (Finite Impulse Response) filters. The basis of these filters is the mathematical model that exhibits the same behaviors as their analog counterparts (inductor, resistor, and capacitor networks). Such mathematical models can be implemented in the software and be used to filter only the frequencies of interest.
- The EXG Pill continuously measures the voltages at the electrodes.
- The analog filter on the PCB blocks all the unwanted signals.
- The microcontroller samples the output voltage from the EXG Pill at a specific frequency that is enough to accommodate all other biological signal frequencies.
- This signal is again filtered through a 4th-order IIR filter to extract only the signals of a specific frequency range. For example, the expected frequency range of an ECG signal is 0.5 – 44.5 Hz and the IIR filter will only allow those signals to pass through.
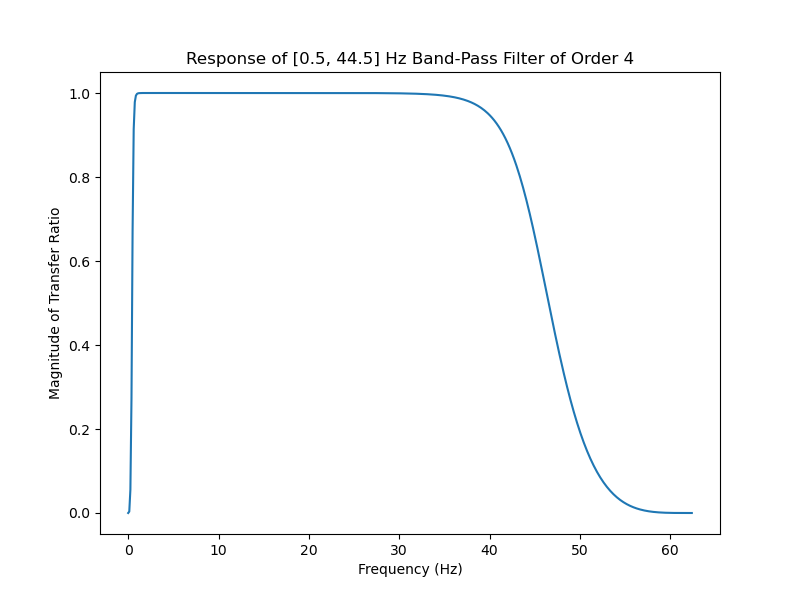
In the example program, Arduino Uno’s ADC samples the analog voltage at A0 pin at a specific rate (125Hz in the example we’re using). Every time, the signal change is monitored and filtered through the 4th-order bandpass filter (ECGFilter() function) whose coefficients are such that it will only allow the ECG pulse to pass. Using a data buffer as a window and standard deviation algorithm (getPeak() function), the program will try to identify peak values in the signal. These peaks correspond to the QRS complex of the ECG signal.
Both the original filtered signal and peak signal values are printed on the serial monitor. If you open the text serial monitor, you can see the actual values being printed. However, it does not read the values and determine what is happening. Instead, you can open the Serial Plotter and see the values printed as a continuous graph. There will be two lines on the graph; Blue indicating the original captured signal and the Red indicating the peak pulses. See the screenshot we captured.
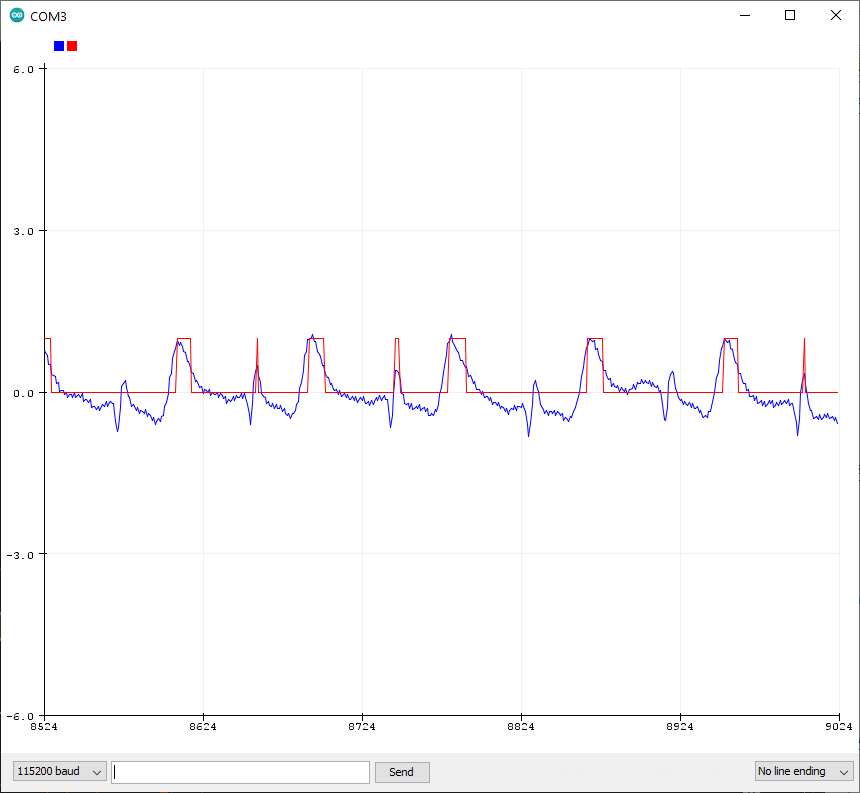
By counting the rectangular pulses arriving in a minute, you can calculate the pulse rate. If you want to know how the filter coefficients are generated, check out this link to a Python script that can be used to generate the code. In future posts, we will explore more of the capabilities of BioAmp EXG Pill. Below is the heartbeat demo video from UDL.
Links
- Upside Down Labs BioAmp EXG Pill – Crowd Supply
- BioAmp EXG Pill – Featured on CIRCUITSTATE
- BioAmp EXG Pill – GitHub Repository
- BioAmp EXG Pill v0.7 Files – GitHub
- Upside Down Labs website
- Upside Down Labs YouTube channel
Short Link
- Short URL to this page – https://circuitstate.com/bioexgpi


You have done a phenomenal job at writing this truly wonderful tutorial Vishnu. I am glad you pointed out specifically where we have to improve. I will be publishing detailed documentation on how BioAmp EXG Pill works and description for each of the example code provided in the repository.
Thank you, and we will update the post as soon as the new documentation is out 👍